Capital Markets
Focus on Alpha. Leave the Real-Time Data Infra to Us.
Process market data, compute portfolio risk, and execute trading signals with sub-millisecond latency — using simple streaming SQL.
Live Market Monitor
StreamingTicks Processed/sec
284,719
● streaming
Portfolio VaR (95%)
$18.3M
updated continuously
Latency P99
0.4ms
● sub-millisecond
Market Status
OPEN
normal trading
Trusted by 1,000+ Data-Driven Organizations
for Real-time Analytics
Trusted by 1,000+ Data-Driven Organizations for Real-time Analytics


Accelerate Time to Insight: Consistent Real-time Analytics You Can Rely On
Capital markets demand fresh, consistent data without tradeoffs. RisingWave delivers millisecond latency with strong consistency, reliability, scalability, and instant recoverability—essential for mission-critical applications.
Sub-Second Latency
In capital markets, every millisecond counts. RisingWave processes streaming data with ultra-low latency, enabling your team to react to market changes instantly.
Consistency
Trade Settlements with Consistency Accuracy is critical for financial transactions and reporting. Ensure exactly-once guarantees, deliver consistent and reliable data to prevent discrepancies in trade settlements and analytics.
Reliability
Market operations can’t afford downtime. Our fault-tolerant, no-SPOF architecture ensures uninterrupted trading and risk management, even during maintenance or unexpected failures.
SQL Simplicity for 10x Productivity
Leave behind the delays of traditional tools. Work with streaming data with PostgreSQL. Build faster, debug easily and achieve real-time results effortlessly.
Meet All Your Event-Driven Processing Needs for Capital Markets’ demanding Use cases with RisingWave
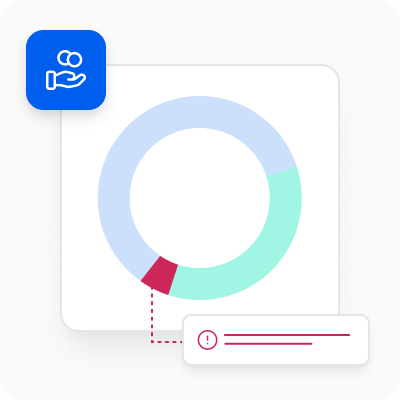
Real-Time Risk Analytics & Management
Instantly monitor and analyze risk exposure to protect assets and ensure operational resilience.
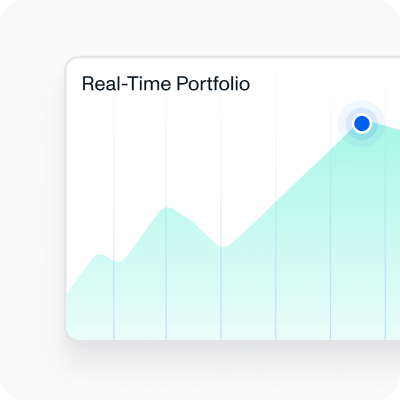
Portfolio & Asset Management
Enable data-driven, real-time portfolio optimization with continuous updates on asset performance.
Market Data Transformation & Enrichment
Process and enrich market data to feed analytics, trading algorithms, and reporting pipelines.
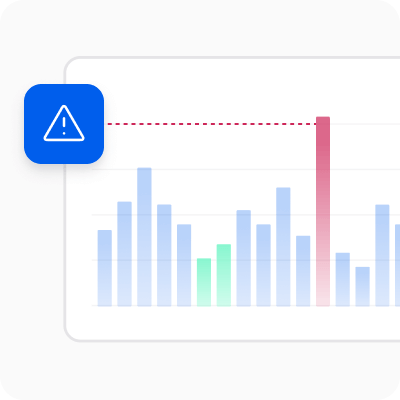
Market & Trade Surveillance
Detect anomalies and safeguard against market abuse with comprehensive monitoring.
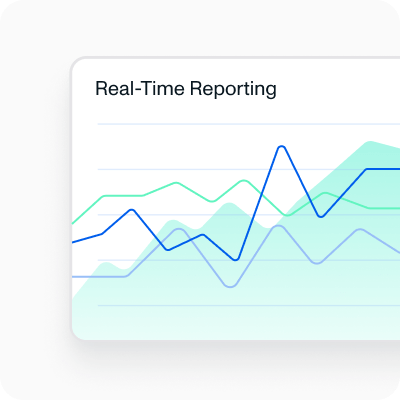
Compliance, Regulatory Reporting & Monitoring
Ensure regulatory compliance with streamlined, real-time reporting capabilities.

Real-Time Fraud Detection
Identify and respond to fraudulent activities as they happen to protect your business and clients.
See RisingWave in Action for Capital Markets
See how RisingWave processes real data in real time — not a recording, not a simulation.
A crypto trading desk monitors Solana DEX activity across Jupiter, Raydium, and Orca. They need to detect whale movements and arbitrage opportunities before the rest of the market reacts — every block (~400ms) matters.
⚠By the time an analyst pulls data from a block explorer, the arbitrage window has closed and the whale has already moved.
LIVEdex_swaps
| signature | slot | program | wallet | token_in | token_out | amount_in | amount_out | ts |
|---|---|---|---|---|---|---|---|---|
| 5vGn...kQ3m | 250847291 | JUP6LkbZbjS1jKKwapdHNy74zcZ3tLUZoi5QNyVTaV4 | 7xKXa9m2pVEb3R8gT4wNdJfLqYsPnpR4n | SOL | BONK | 14.2 | 1142857 | 2024-03-15T14:32:01.412Z |
| 3kRp...wN8j | 250847293 | 675kPX9MHTjS2zt1qfr1NYHuzeLXfQM9H24wFSUt1Mp8 | 7xKXa9m2pVEb3R8gT4wNdJfLqYsPnpR4n | USDC | BONK | 8500 | 680000 | 2024-03-15T14:32:02.204Z |
| 9mTx...bL5e | 250847295 | whirLbMiicVdio4qvUfM5KAg6Ct8VwpYzGff3uctyCc | 7xKXa9m2pVEb3R8gT4wNdJfLqYsPnpR4n | SOL | BONK | 6.8 | 537142 | 2024-03-15T14:32:03.891Z |
| 2hYd...pK7v | 250847294 | JUP6LkbZbjS1jKKwapdHNy74zcZ3tLUZoi5QNyVTaV4 | Bq4rJ7pVEcSan3k9dTx5NLzRmA8HYfJp2 | SOL | JUP | 245.5 | 18412.5 | 2024-03-15T14:32:02.687Z |
| 7fWm...cR2a | 250847296 | 675kPX9MHTjS2zt1qfr1NYHuzeLXfQM9H24wFSUt1Mp8 | DxP8rNfvYk4G2mBz5QLr9TJa3nYhR6wKm | USDC | WIF | 42000 | 14000 | 2024-03-15T14:32:04.118Z |
| 4nBx...hT9q | 250847297 | JUP6LkbZbjS1jKKwapdHNy74zcZ3tLUZoi5QNyVTaV4 | DxP8rNfvYk4G2mBz5QLr9TJa3nYhR6wKm | WIF | SOL | 14000 | 251.3 | 2024-03-15T14:32:04.802Z |
Streaming SQLRunning
▶Track whale accumulation patterns✓
CREATE MATERIALIZED VIEW whale_accumulation AS
SELECT
  wallet,
  token_out AS token,
  SUM(amount_out) AS total_amount,
  COUNT(*) AS swap_count,
  COUNT(DISTINCT program) AS dex_count,
  window_start
FROM TUMBLE(dex_swaps, ts, INTERVAL '30 SECONDS')
GROUP BY wallet, token_out, window_start
HAVING
  SUM(amount_in) > 10000
OR COUNT(*) > 3;▶Detect cross-DEX arbitrage✓
whale_accumulationauto-updating
| wallet | token | total_amount | swap_count | dex_count | window_start |
|---|---|---|---|---|---|
| 7xKX...pR4n | BONK | 2613967 | 4 | 3 | 2024-03-15T14:32:00.000Z |
| DxP8...6wKm | WIF | 14000 | 1 | 1 | 2024-03-15T14:32:00.000Z |
| Bq4r...Jp2 | JUP | 18412.5 | 1 | 1 | 2024-03-15T14:32:00.000Z |
✓RisingWave detects wallet 7xKX...pR4n accumulating 2.3M BONK across 3 DEXes in 12 seconds. The desk repositions before the price impact fully propagates.
Work with the Tools and Languages You Already Know and Skip the Learning Curve
SQL
-- Create a materialized view to continuously calculate portfolio positions.
CREATE MATERIALIZED VIEW portfolio_monitoring AS
SELECT
  o.user_id,
  o.asset_id,
  SUM(o.quantity) AS net_quantity,
  md.price AS current_price,
  SUM(o.quantity) * md.price AS position_value
FROM
  orders AS o
JOIN
  market_data AS md
ON
  o.asset_id = md.asset_id
GROUP BY
  o.user_id,
  o.asset_id,
  md.price;
Python
# Create a materialized view for average stock prices over 1-minute intervals
mv = rw.mv(
  name="avg_stock_price_mv",
  stmt="""
    SELECT
      window_start,
      window_end,
      symbol,
      ROUND(AVG(price), 2) AS avg_price
    FROM
      TUMBLE(stock_trades, timestamp, INTERVAL '1 minute')
    GROUP BY
      window_start,
      window_end,
      symbol
  """
)

# Fetch the result into a pandas DataFrame
result: pd.DataFrame = rw.fetch("""
  SELECT
    window_start,
    window_end,
    symbol,
    avg_price
  FROM
    avg_stock_price_mv
""", format=OutputFormat.DATAFRAME)

# Display the result
print(result)
Essential Features for Your Success
As-of Joins
Seamlessly join data streams based on time proximity, enhancing decision-making with precise temporal data alignment.
Time-Travel Queries
Travel back to previous time point and perform cross sectional analysis. compliance, auditing, and strategic insights.
Time-Series Functionalities
Gapfilling, downsampling, rollup, and many more. Conduct advanced analysis on time-series data, powering financial forecasting and trend analysis.
Integration with Popular Systems
Seamlessly integrate with Kafka, Pulsar, Solace, and other critical systems across your trading infrastructure, ensuring full interoperability.