

Real-time data analysis is becoming crucial across various applications, from financial risk management and social networking to recommendation systems and the Internet of Things. While traditional analytics provides timely insights into dynamic changes, many datasets also contain complex graph relationships that present unique challenges. Real time graph analytics is specifically designed to capture and analyze these intricate connections on the fly. For example, in a bustling financial market, millions of transactions and interactions occur every moment, forming a dynamic network among traders, financial institutions, and trading instruments. Rapidly detecting subtle shifts in these interconnections, such as emerging fraud rings, abnormal trading patterns, or changing market sentiment is crucial for effective risk management and timely investment decisions.
In this article, we will explore how to build a real time graph analytics pipeline using RisingWave and PuppyGraph, enabling us to overcome these challenges and achieve efficient, real time graph data processing and analysis. First, let us look more closely at RisingWave and PuppyGraph.
RisingWave: The Backbone of Real-Time Data Streaming and CDC
RisingWave is a modern SQL-based data platform, fully compatible with PostgreSQL, crafted to serve the dynamic needs of today’s data-driven applications. Designed with versatility in mind, it powers event-driven architectures, real-time ETL pipelines, continuous analytics services, and feature stores for AI, making it an essential tool for organizations aiming to harness the value of their data. RisingWave excels at delivering fresh, consistent insights from a variety of sources, whether processing live event streams, capturing database changes through CDC, or analyzing time series data.
Its high-performance architecture is engineered to produce results in sub-second latency, a critical capability for scenarios where rapid decision-making is paramount. By seamlessly integrating the strengths of both stream and batch processing, RisingWave enables users to effortlessly ingest, join, and analyze real-time as well as historical data within a single unified framework. This convergence not only simplifies complex data workflows but also enhances analytical agility.
Moreover, RisingWave’s cloud-native design ensures that it can scale effortlessly to meet increasing workloads while maintaining robust reliability. Whether deployed in a managed cloud environment or on a self-hosted infrastructure, the platform’s elastic scalability and resilient performance make it well-suited for even the most demanding data applications. In essence, RisingWave empowers organizations to unlock real-time insights and drive innovation, offering a flexible and efficient solution that adapts to the ever-evolving landscape of modern data processing.
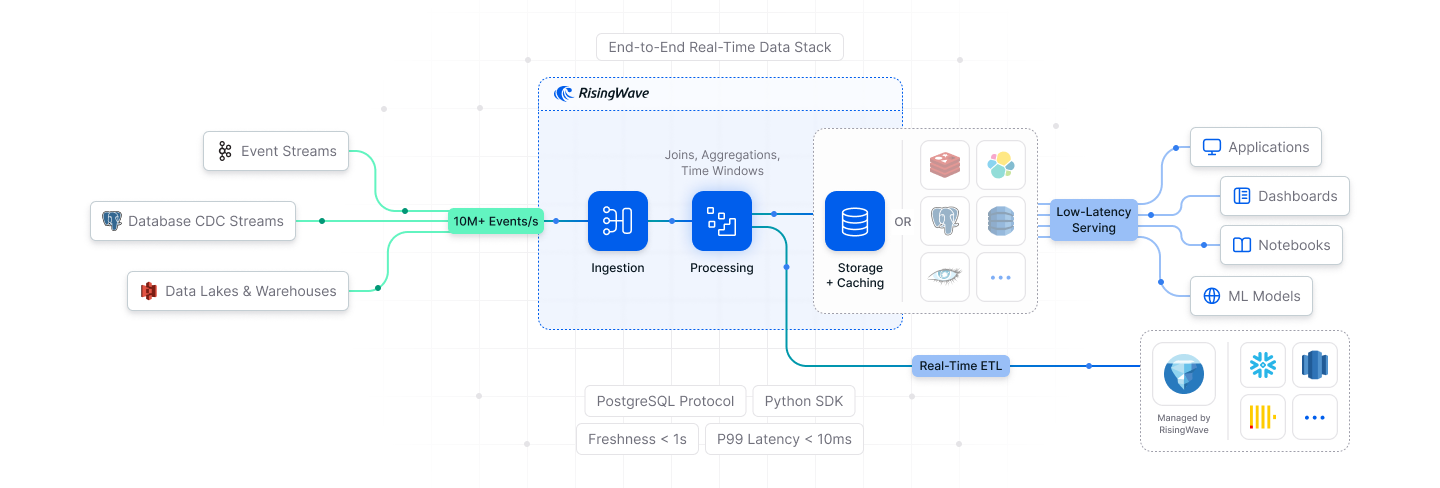
Figure: Real-Time Data Stack with RisingWave
PuppyGraph: Query Your Relational Data as a Graph in Real Time
PuppyGraph is the first and only real time, zero-ETL graph query engine in the market, empowering data teams to query existing relational data stores as a unified graph model in under 10 minutes, bypassing traditional graph databases' cost, latency, and maintenance hurdles. Designed for modern data driven applications, PuppyGraph eliminates the complexities of data migration and duplication while ensuring your data remains fresh and up to date. This zero ETL approach enables organizations to leverage their existing data stores without incurring extra cost or delay from data replication whether you deploy in the cloud or on self hosted infrastructure.
Engineered for rapid performance and scalability, PuppyGraph is built to handle terabyte scale datasets and even petabytes while managing billions of interconnected relationships. With support for popular graph query languages like Gremlin and openCypher, PuppyGraph makes it effortless to explore intricate data relationships and discover hidden patterns that might otherwise go unnoticed. This seamless integration of graph and relational paradigms simplifies complex workflows and enhances analytical agility across a wide range of use cases from fraud detection and cybersecurity to telemetry log analytics and beyond.
PuppyGraph transforms the way businesses access and analyze interconnected data, enabling them to find valuable insights instantly while maintaining data integrity and operational simplicity.
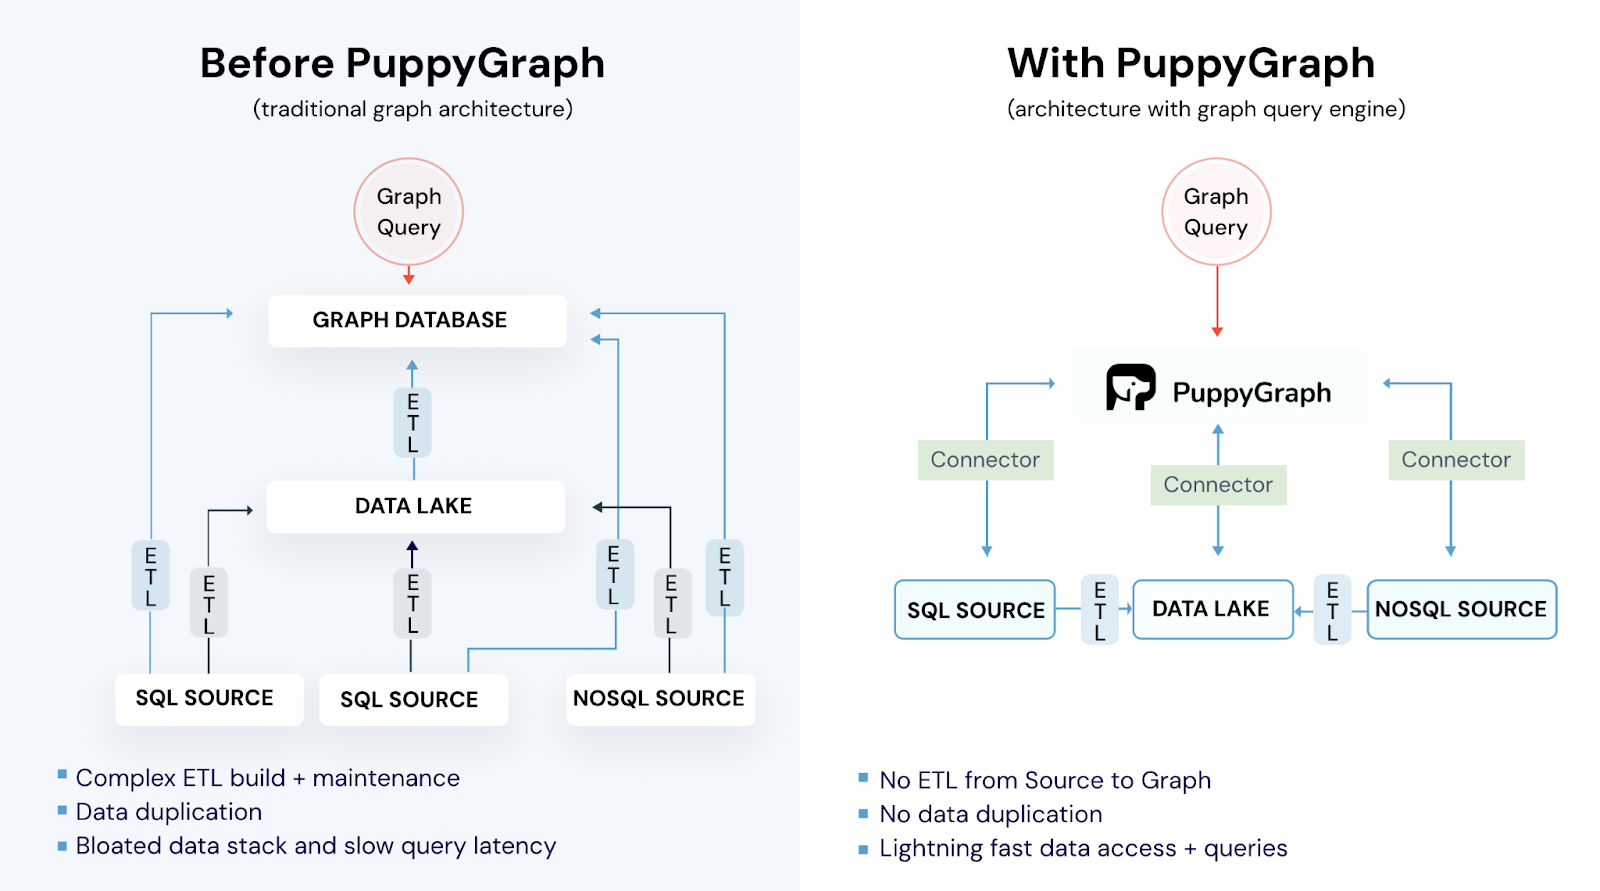
Figure: Graph Database Architecture vs. PuppyGraph Graph Query Engine Architecture
RisingWave + PuppyGraph: Real Time Graph Analysis For Your Relational Data
The seamless integration of RisingWave and PuppyGraph creates a powerful real time graph analytics pipeline that bridges the gap between high speed data processing and deep relational insights. RisingWave continuously captures and processes live data streams, change data capture events, and historical records in one unified framework. This means that organizations have immediate access to fresh, consistent data with sub second latency, which is essential for fast decision making in dynamic environments.
Building on this robust data foundation, PuppyGraph transforms the output into a comprehensive graph model without the need for any ETL. By directly querying multiple data sources as a single graph, data teams can uncover intricate relationships and hidden patterns that might be missed or extremely complex to write with traditional SQL analytics.
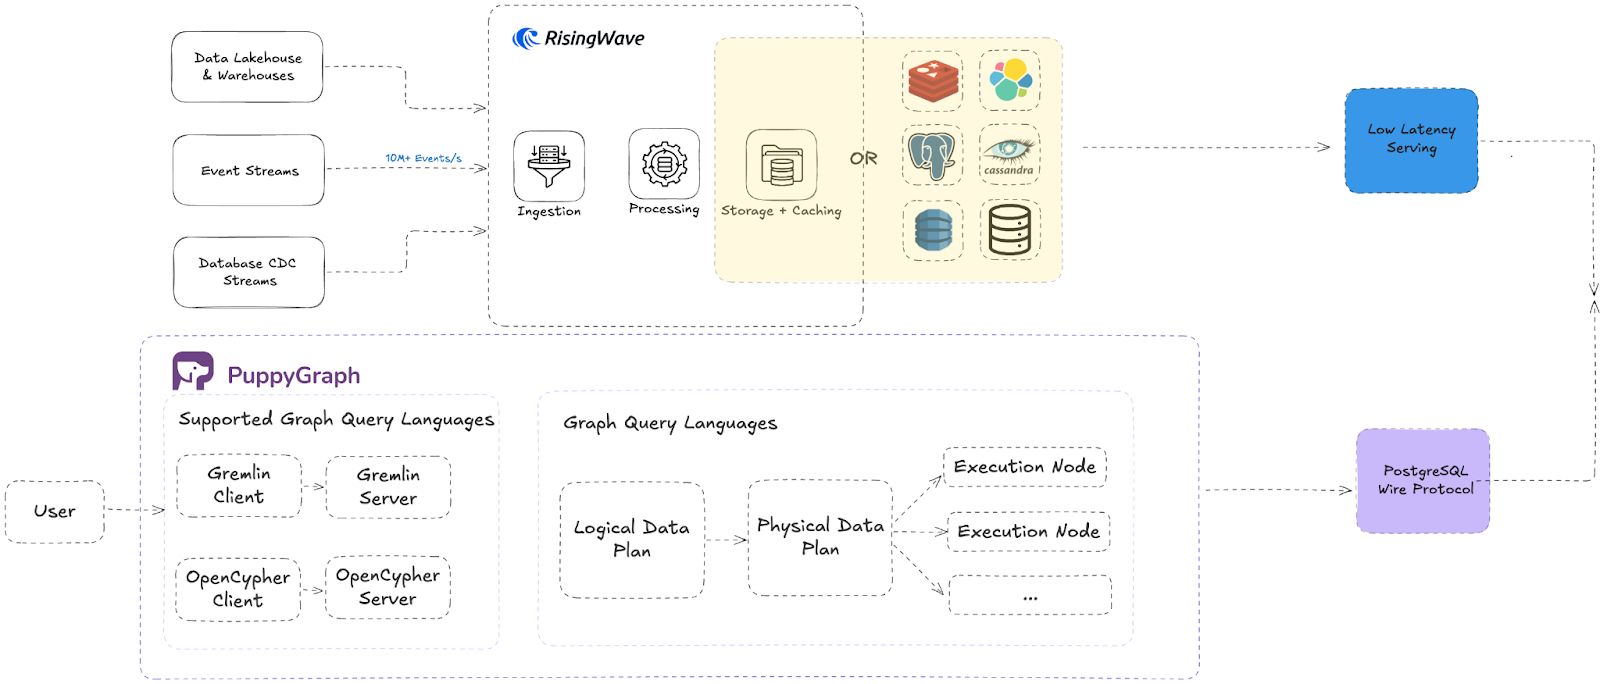
Figure: Architect diagram with RisingWave & PuppyGraph
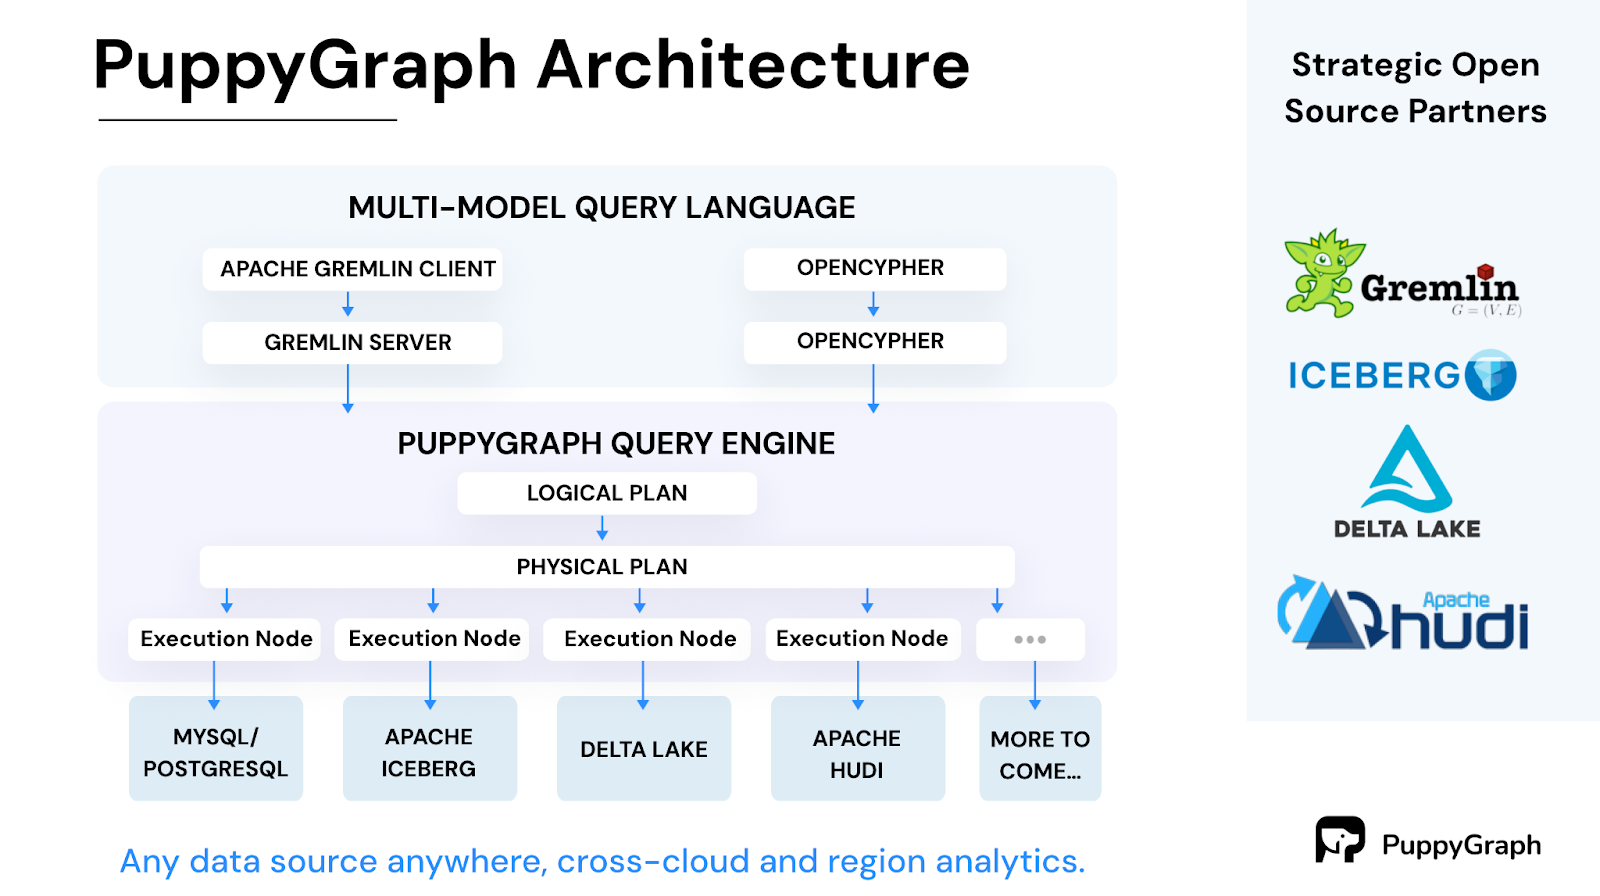
Figure: PuppyGraph architecture diagram
Demo
Now, let's see how it works with a quick step by step demo. Detailed instructions and materials are available in this GitHub repository. The demo data is derived from the LDBC Financial Benchmark. This benchmark defines workloads and datasets for graph databases, simulating real-world financial scenarios such as anti-fraud and risk management.
Prerequisites
Start the Services
Run the command below to start the services including the pipeline: KafKa, RisingWave and PuppyGraph.
docker compose up -d
Creating a Python Virtual Environment
Create a Python virtual environment and install the confluent_kafka package.
python3 -m venv myvenv
source myvenv/bin/activate
pip install confluent-kafka
Creating Kafka Topics
Run the python script topics.py to create topics.
python topics.py -c
RisingWave Connecting to Kafka
Execute the SQL commands in rw_kafka.sql using the PostgreSQL client.
psql -h localhost -p 4566 -d dev -U root -f rw_kafka.sql
This creates sources and corresponding materialized views for each stream. For example, the kafka-Account topic uses these SQL commands:
CREATE SOURCE IF NOT EXISTS account_stream (
  "label" varchar,
  "accountId" bigint,
  "createTime" timestamptz,
  "isBlocked" boolean,
  "accountType" varchar,
  "nickname" varchar,
  "phonenum" varchar,
  "email" varchar,
  "freqLoginType" varchar,
  "lastLoginTime" timestamptz,
  "accountLevel" varchar
)
WITH (
  connector='kafka',
  topic='kafka-Account',
  properties.bootstrap.server='kafka:9092',
  scan.startup.mode='earliest'
)
FORMAT PLAIN ENCODE JSON;
and
CREATE MATERIALIZED VIEW IF NOT EXISTS account_mv AS
  SELECT * FROM account_stream;
Importing Snapshot Data
Run the python script topics.py to import the snapshot data.
python topics.py -s
Querying in RisingWave (Optional)
You can check the snapshot data in RisingWave via PostgreSQL client.
psql -h localhost -p 4566 -d dev -U root
For example: List tables, views, and sequences:
\d
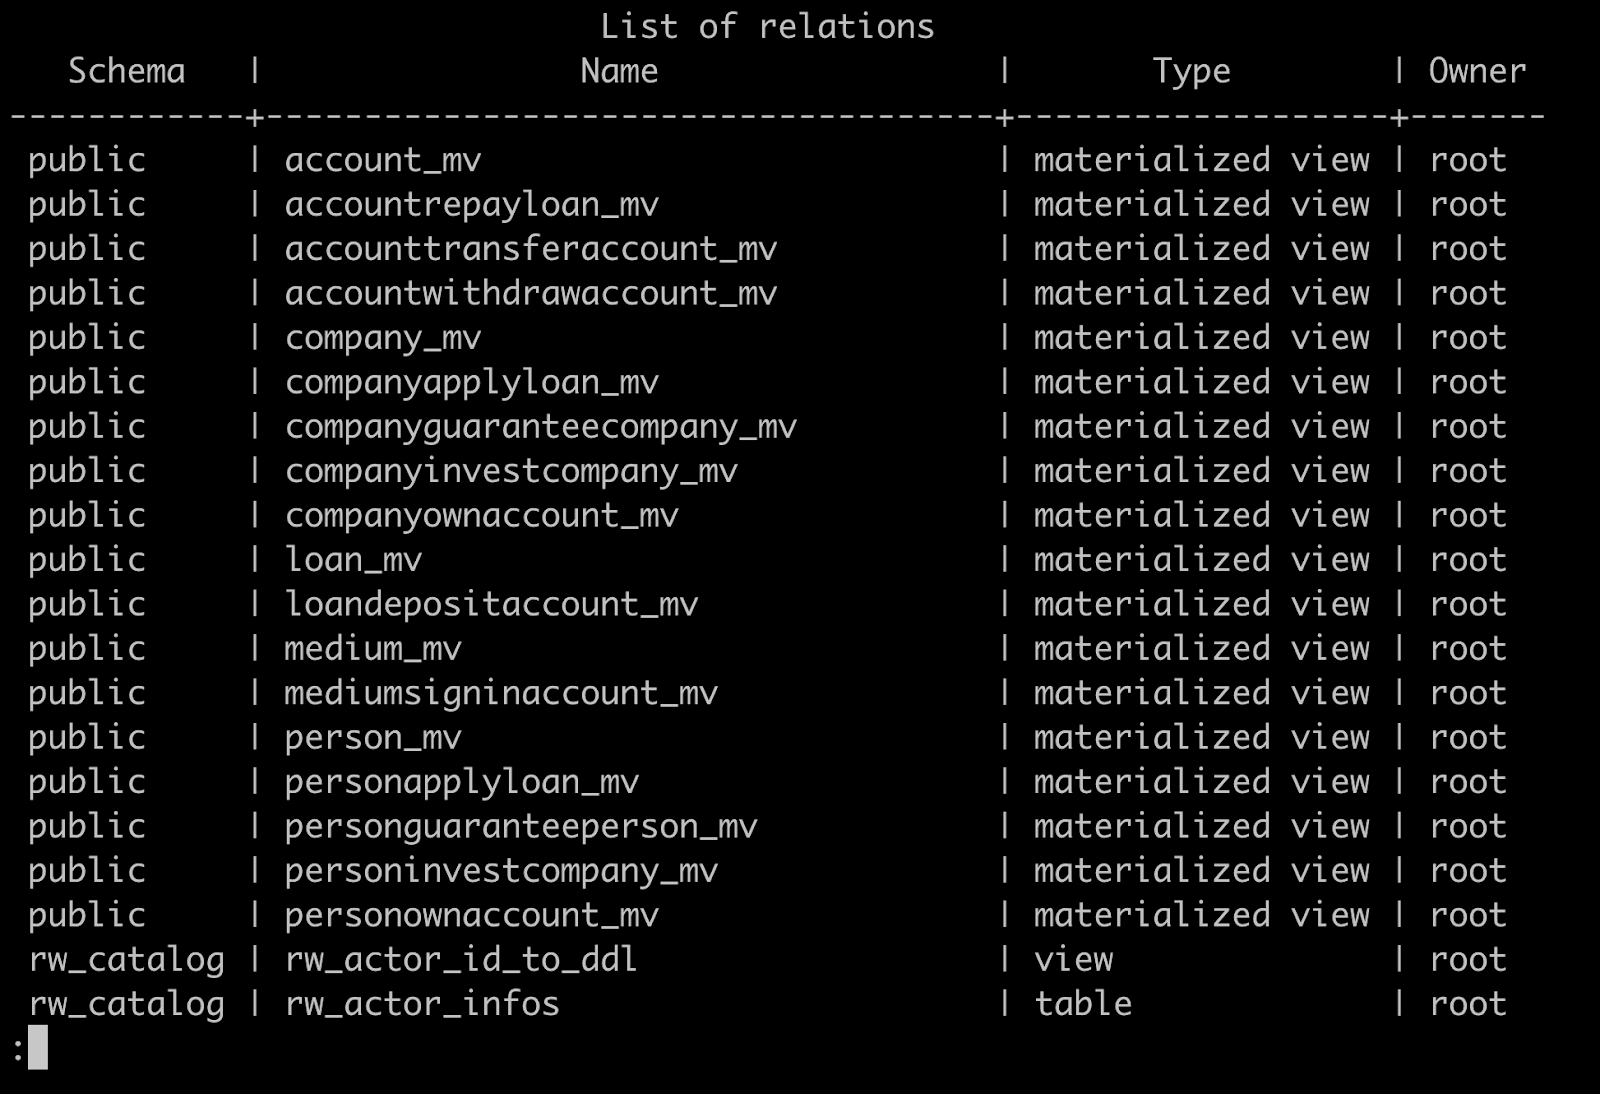
Figure: List tables, views, and sequences with \d command.
Modeling the Graph
Log into the PuppyGraph Web UI at http://localhost:8081 with the following credentials:
Username:
puppygraphPassword:
puppygraph123
Upload the schema: In Web UI, select the file schema.json under Upload Graph Schema JSON, then click on Upload.
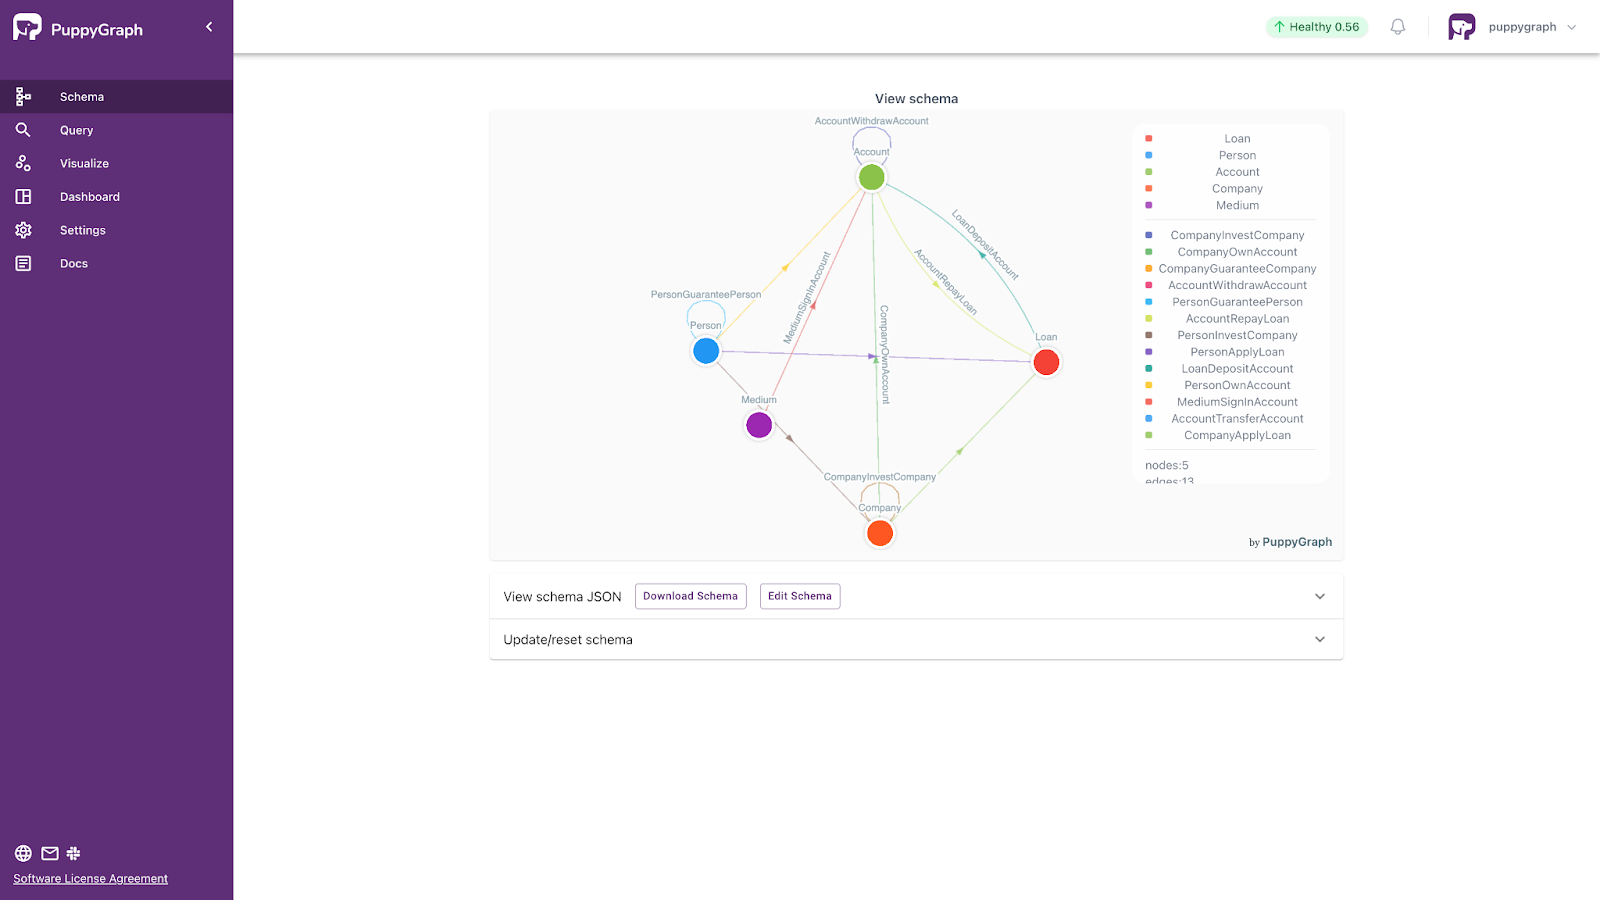
Figure: Graph schema of the financial data
Querying via PuppyGraph
You can try some Gremlin or Cypher queries of the snapshot data for PuppyGraph.
Navigate to the Query panel on the left side. The Gremlin Query tab provides an interactive environment for querying the graph using Gremlin.
After each query, clear the graph panel before executing the next query to maintain a clean visualization. Click Clear at the top-right corner of the page.
For Cypher queries, you can use Graph Notebook and Cypher Console.
For example:
Gremlin: Get the number of accounts.
g.V().hasLabel('Account').count()Cypher: Get the number of accounts.
MATCH (x:Account) RETURN count(x)
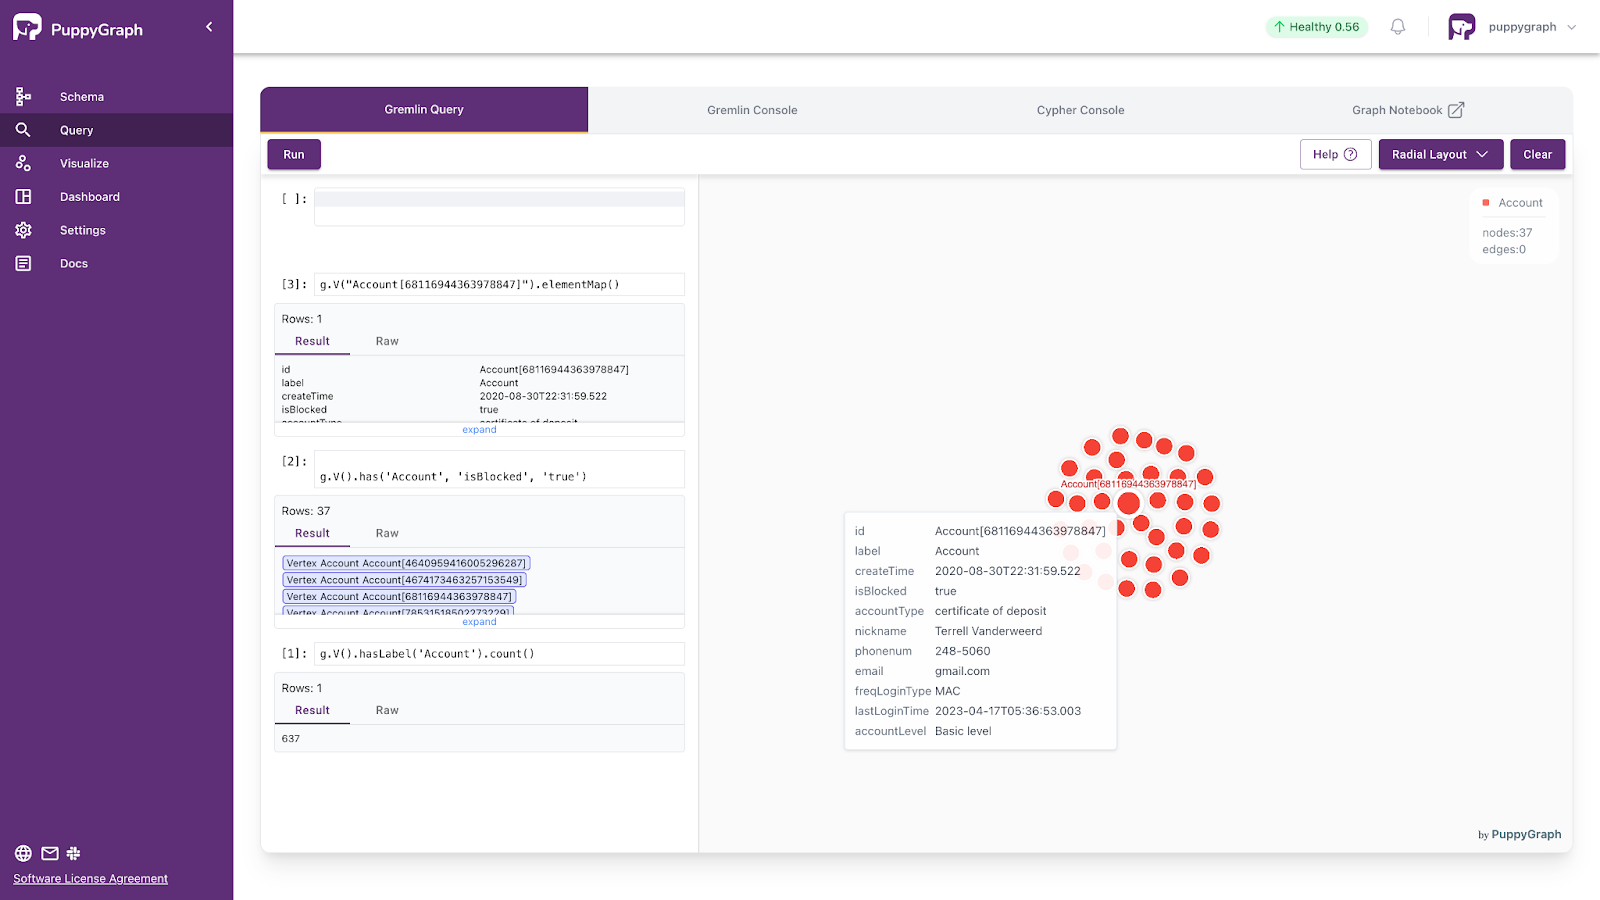
Figure: Query the snapshot data
Import Incremental Data
Run the python script topics.py to import the incremental data.
python topics.py -i
Querying via PuppyGraph in Real Time
You can continue querying in PuppyGraph and see the results change as new data is added.
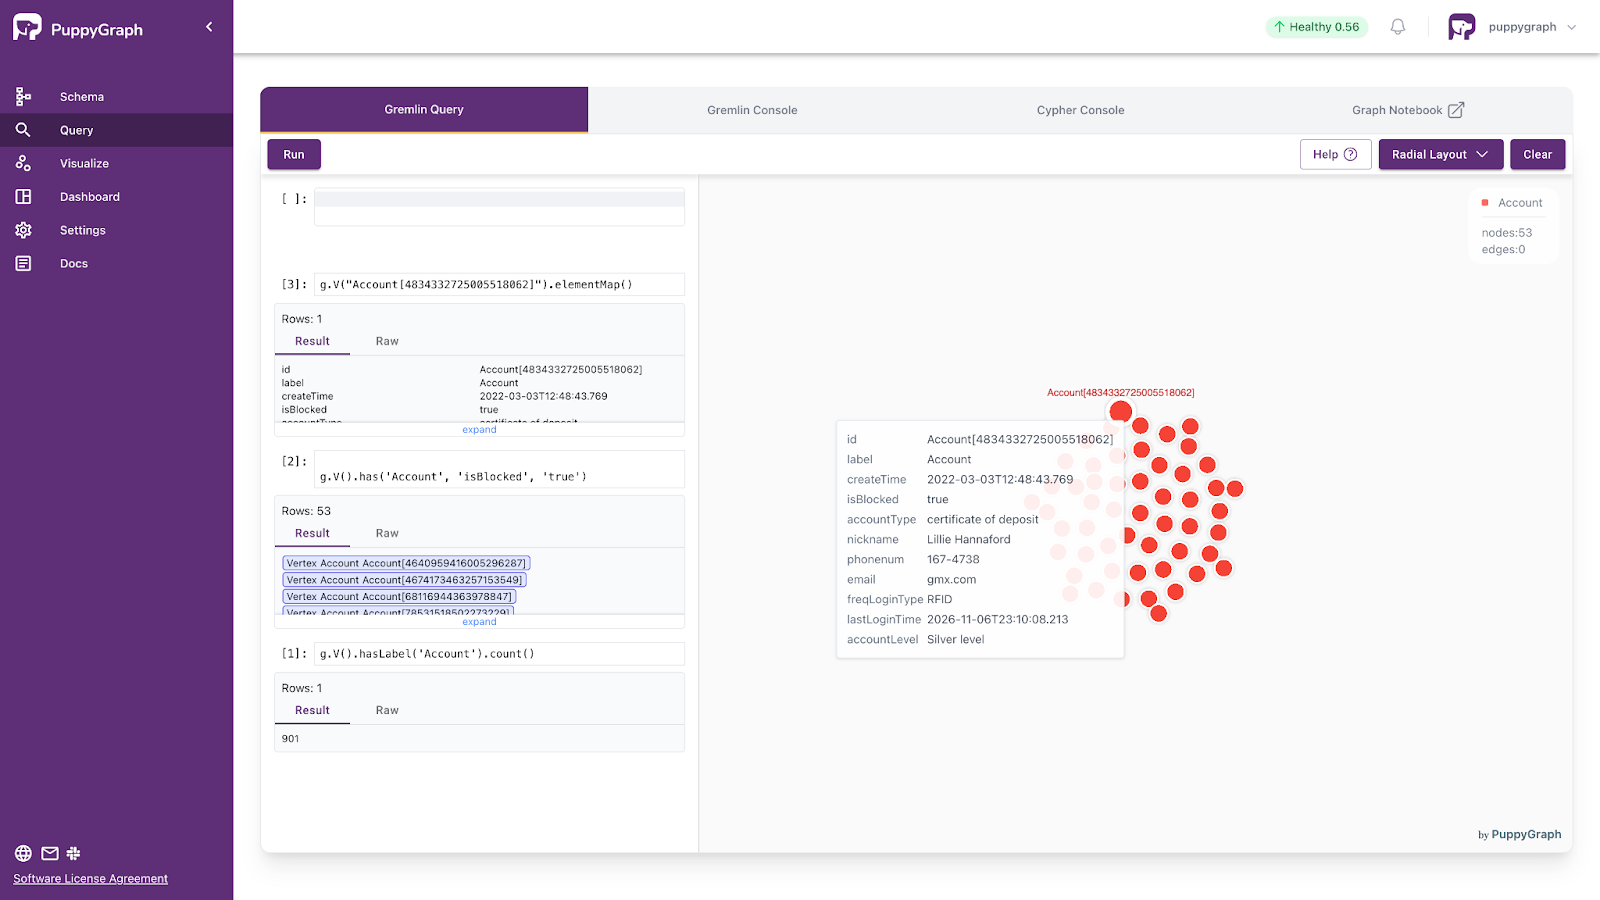
Figure: Query results change as incremental data is added
Cleanup and Teardown
To stop and remove the containers and networks, run:
docker compose down -v
Conclusion
In summary, we built a real time graph analytics pipeline using RisingWave and PuppyGraph. RisingWave captures and processes live data with sub-second latency, while PuppyGraph transforms relational data into a unified graph view without any ETL. Our demo showed how to set up the pipeline—from Kafka ingestion to graph modeling and querying—providing immediate, actionable insights with an interactive graph visualization UI.
If you're interested in this joint setup, you can get started for free—try RisingWave Cloud and download the forever free PuppyGraph Developer Edition today!