

Imagine a business struggling to keep up with real-time customer demands due to slow data processing. They notice traditional batch sequential methods introduce high latency and limited flexibility. A dataflow graph changes this scenario. Data moves through a series of transformation modules, supporting both sequential and parallel operations. In a dataflow graph, each node represents a transformation, and this structure enables incremental, interactive, and distributed data processing. Systems such as tensorflow rely on this approach, allowing data to flow efficiently and adapt to dynamic workloads. Unlike older models, tensorflow leverages the dataflow graph to support concurrency and fine-grained control, reducing unnecessary data movement. By using tensorflow, organizations can process data with high throughput and react quickly to user interactions. The dataflow graph architecture in tensorflow also allows for splitting computation between server and client, optimizing performance. Machine learning models in tensorflow select the best execution plan, making data processing scalable and interactive. With tensorflow, businesses achieve better performance by consolidating operations and minimizing redundant data transfers. This modern approach empowers teams to handle complex data systems with confidence.
Key Takeaways
Dataflow graphs map how data moves and transforms through operations, enabling parallel and real-time processing for faster results.
Key parts of dataflow graphs include nodes that perform tasks and edges that carry data, working together to optimize computation and reduce delays.
Tensorflow uses dataflow graphs to boost efficiency and scalability, handling large and streaming data smoothly across distributed systems.
Clear visualization and documentation in dataflow graphs help teams understand, debug, and improve complex data pipelines easily.
Many industries rely on dataflow graphs to enhance performance, ensure compliance, and support fast, data-driven decisions.
Dataflow Graph Overview
Definition
A dataflow graph serves as a foundational model in data processing, representing computations by mapping out data dependencies among operations. In this structure, each node stands for an instruction or operation, while edges indicate the flow of data and the dependencies between these instructions. This approach allows independent operations to execute in parallel, which highlights the inherent concurrency of the model. The dataflow graph enables systems to process data as soon as it becomes available, rather than waiting for a sequential program counter to advance.
Historically, computer scientists developed the dataflow graph to address the limitations of traditional von Neumann architectures. In the early 1970s, Jack Dennis at MIT introduced static dataflow architectures, where actors fired only when all inputs were ready. Later, dynamic models allowed multiple concurrent activations, further exposing parallelism. These innovations influenced programming languages, processor design, and the evolution of computational graph models used in modern distributed systems.
A dataflow graph differs from a typical directed acyclic graph because it models not just the direction of computation but also the asynchronous flow of data tokens. Each node, or actor, fires when its input data is ready, consuming tokens and producing outputs for downstream nodes. This mechanism supports efficient pipelining and parallel execution, which are essential for large-scale data processing.
Note: The computational graph concept extends beyond data engineering. In machine learning frameworks, a computational graph describes how data flows through mathematical operations, enabling optimization and parallel execution.
Core Components
A dataflow graph consists of several essential components that work together to enable efficient data processing. Each component plays a specific role in structuring and executing the computational graph.
Nodes (Operators/Vertices):
These represent the fundamental units of computation within the graph.
Types of nodes include:
Source Operators: Read data from external systems such as Kafka or Pulsar.
Transformation Operators: Perform operations like map, filter, aggregate, join, and windowing, transforming the data as it moves through the pipeline.
Sink Operators: Write processed results to external systems, including databases or message queues.
Edges (Streams/Channels):
Edges define the data flow between nodes, carrying data records from one operation to the next.
They also determine how data is partitioned or shuffled, such as through hash or broadcast strategies, especially in parallel processing scenarios.
Logical Graph:
This abstract representation shows the high-level structure of the computation as defined by user code or queries.
It outlines the relationships between operations without specifying execution details.
Physical Graph:
The physical graph details the execution plan generated by the system optimizer.
It specifies operator implementations, parallelism, task chaining, and data exchanges, ensuring efficient distributed execution.
| Aspect | Description |
| Nodes (Actors) | Represent elemental operations, each with defined input and output arcs |
| Edges | Indicate data dependencies or token flows |
| Token Flow | Operates asynchronously, enabling parallelism without control tokens |
| Restrictions | Enforces homogeneous input/output conditions for actors |
| Conditional Structures | Models iterative and conditional logic without explicit control tokens |
| Properties | Guarantees determinacy despite asynchronous execution |
The firing mechanism of each node ensures that data-driven computation proceeds as soon as inputs are ready. This approach eliminates the need for explicit synchronization, which is common in traditional programming models. In streaming job graph scenarios, this structure allows for real-time data processing and rapid adaptation to changing workloads.
Modern distributed systems, such as those used in cloud computing and big data analytics, rely on the computational graph to unify batch and streaming APIs. These systems support stateful processing, fault recovery, and scalable execution across multiple nodes. The computational graph model underpins platforms that handle both batch and streaming data, optimizing for low latency and high throughput.
The dataflow graph also plays a crucial role in debugging and error tracing. Visualization tools allow engineers to pinpoint failures at specific stages, trace data flow across the pipeline, and isolate problematic inputs. This capability streamlines the maintenance of complex data pipelines and enhances reliability.
💡 Tip: When designing a data flow, consider how each component of the computational graph contributes to scalability, clarity, and efficiency. A well-structured dataflow graph simplifies both development and troubleshooting.
Data Flow Diagram
A data flow diagram (DFD) offers a visual approach to mapping data flows within an information system. Larry Constantine developed the DFD based on the data flow graph model of computation by Martin and Estrin. Both concepts share a focus on visualizing how data moves and transforms through processing nodes. In system analysis, a DFD represents the flow of data, showing how information enters, gets processed, and exits a system. This approach aligns closely with dataflow graphs, which also emphasize data movement and transformation. Structured system analysis and design methods, such as SSADM, rely on DFDs to provide a clear, layered view of data flow, starting from a broad context and drilling down into detailed subprocesses. This method highlights the importance of mapping data flows and understanding the relationships between different system components.
Data Flow Diagram Example
A practical data flow diagram example helps clarify its role in system analysis. Consider these real-world scenarios:
A food establishment uses a DFD to show how a customer submits a reservation request. The system processes the request, finds a table, stores guest information, and returns reservation details.
An online purchase system uses a DFD to illustrate the journey of customer data from order initiation to confirmation.
A CRM system relies on a DFD to manage customer data inputs and outputs.
A library management system uses a DFD to track book inventory and send user alerts.
These examples demonstrate how mapping data flows with a DFD can reveal bottlenecks, improve efficiency, and enhance understanding of complex data processing systems.
Visualization Benefits
A DFD provides several visualization benefits for mapping data flows in complex environments:
Teams gain cross-functional visibility, as a DFD offers a unified visual framework that aligns engineering, analytics, product, and operations.
Mapping data flows with a DFD helps identify bottlenecks and inefficiencies, making it easier to optimize performance.
DFDs support data quality and governance planning by highlighting where data is collected, transformed, or stored.
They accelerate onboarding and integration by providing a quick reference for how new data sources interact with existing systems.
Clear visual components—such as processes, data stores, external entities, and labeled directional flows—make complex data interactions easier to manage.
Hierarchical DFD levels allow teams to explore system details progressively, enhancing clarity without overwhelming viewers.
💡 A well-constructed data flow diagram simplifies communication, supports better decision-making, and ensures that all stakeholders understand how data moves through the system.
Benefits
Efficiency
Efficiency stands at the core of modern data processing, especially in environments powered by tensorflow. The platform leverages a tensor-centric approach, where each tensor flows through a well-defined pipeline. This design enables rapid transformation and aggregation of data, supporting both batch and streaming workloads. Tensorflow optimizes the movement of each tensor, ensuring that data flows seamlessly from ingestion to output, whether the task involves real-time analytics or large-scale batch jobs.
Tensorflow enables scalable and managed pipelines by processing tensors in parallel across multiple virtual machines with autoscaling.
The unified pipeline model supports both batch and streaming data processing, delivering low-latency and exactly-once processing guarantees.
Data flows through distinct stages—reading, transforming, aggregating, and writing—allowing flexible and efficient workflow design.
Graphical representations and robust monitoring tools in tensorflow help teams observe and optimize performance, reducing operational overhead.
Pipelines in tensorflow promote reusability, security, and integration with other services, making it easier to manage large data volumes and complex workflows.
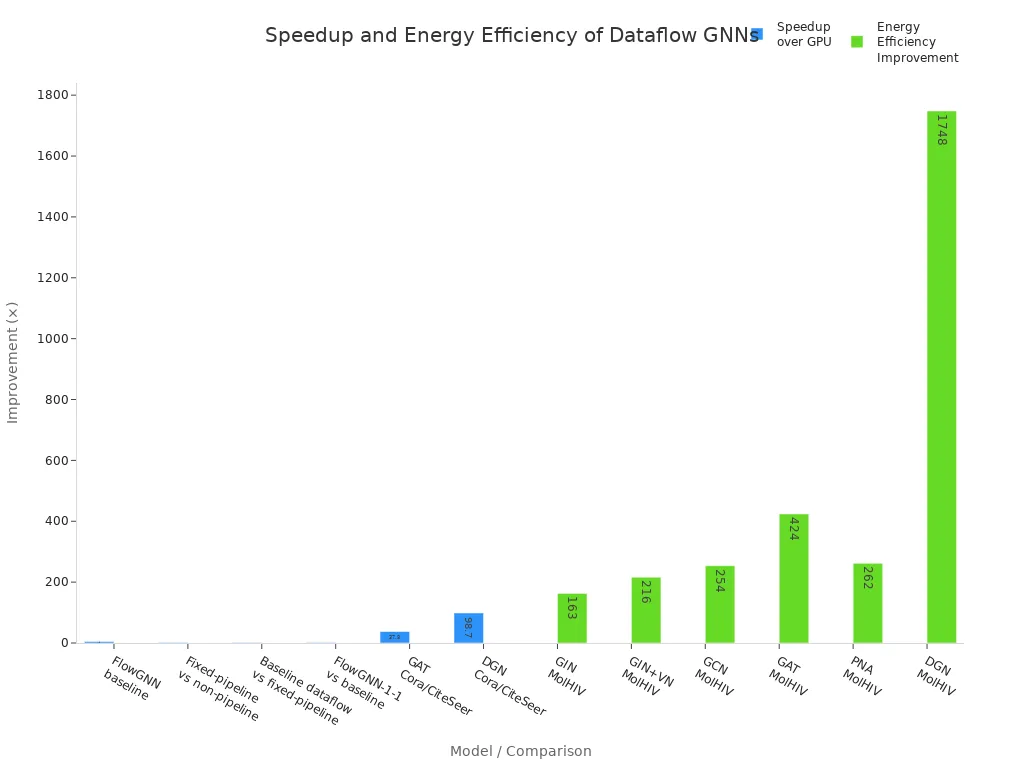
Quantitative improvements in processing speed and resource utilization further highlight tensorflow's efficiency. The following table summarizes observed speedups and energy efficiency gains when using advanced tensor-based models:
| Metric / Model | Speedup over GPU | Speedup over CPU | Energy Efficiency Improvement over GPU |
| FlowGNN baseline (non-pipelined NT and MP) | ~4.9× faster | N/A | N/A |
| Fixed-pipeline vs non-pipeline | 1.66× faster | N/A | N/A |
| Baseline dataflow vs fixed-pipeline | 1.38× faster | N/A | N/A |
| FlowGNN-1-1 (pipelined NT/MP) vs baseline | 1.45× faster | N/A | N/A |
| FlowGNN overall speedup on MolHIV dataset (batch size 1) | 53.4–477.6× faster | 51.0–254.7× faster | 163–1748× energy efficiency |
| FlowGNN speedup on HEP dataset (batch size 1) | 13.3–443.4× faster | 23.5–218.6× faster | N/A |
| Specific GNN models speedup over GPU on Cora and CiteSeer datasets | GAT: 37.8× to 69.6×, DGN: 98.7× to 127.4× | N/A | N/A |
| Energy efficiency on MolHIV dataset (graphs/kJ) | GIN: 163×, GIN+VN: 216×, GCN: 254×, GAT: 424×, PNA: 262×, DGN: 1748× | N/A | N/A |
Multi-threaded scheduling in tensorflow achieves up to 18% reduction in run-time compared to simpler schedulers. The DTT scheduler improves run-time by 5.66% to 18.0% over basic approaches, ensuring structured performance gains. While hand-written schedulers remain the fastest, tensorflow's graph-based schedulers closely approach their efficiency, making them practical for both research and production.
🚀 Tensorflow's efficiency comes from its ability to process tensors in parallel, optimize resource allocation, and minimize redundant computation, making it ideal for both streaming and batch data processing.
Scalability
Scalability defines the ability of tensorflow to handle increasing data volumes and adapt to diverse computing environments. The platform's tensor-based architecture decomposes large tasks into small, independent units, which can be executed in parallel across distributed systems. This approach increases parallelism and efficiency, especially in streaming scenarios where data arrives continuously.
The FlowUnits model in tensorflow extends traditional data flow programming by incorporating locality awareness, resource awareness, and dynamic update capabilities. This enables deployment of complex processing pipelines across heterogeneous and geo-distributed edge-to-cloud environments. Tensorflow transforms data flow into a scalable and flexible technology, suitable for decentralized computing landscapes and distributed data analysis.
Tensorflow enables scalability by partitioning large graphs into smaller chunks, allowing distributed and parallel processing across clusters.
FPGA-based graph processing in tensorflow allows parallel execution of operations such as filtering, sorting, and memory access, outperforming CPUs and GPUs.
Partitioning schemes like GridGraph recursively split large graphs, enabling efficient handling of datasets that exceed main memory capacity.
Distributed frameworks, including Hadoop, integrate with tensorflow to store large datasets across clusters and enable cost-effective scaling by adding or removing nodes.
Integration of locality and resource awareness, as well as dynamic update capabilities, supports flexible and scalable data processing pipelines in streaming and batch modes.
Advanced modeling and optimization tools, such as the Process Designer and DMI Process Optimization Engine, apply logical and physical optimizations to tensorflow's execution plans. These tools enable semi-automatic optimization and efficient mapping to hardware and software resources, maintaining performance even as data volumes increase. Incremental execution models in tensorflow avoid unnecessary re-executions, saving computational resources and ensuring outputs are updated rather than fully recomputed. This is critical for handling large, continuously changing datasets efficiently.
💡 Tensorflow's scalable architecture ensures that as data volumes grow, performance remains stable, and resource consumption stays optimized, making it a preferred choice for enterprise-scale streaming and batch data processing.
Clarity
Clarity in data processing logic is essential for system designers, analysts, and multidisciplinary teams. Tensorflow enhances clarity by embedding annotations and documentation directly on the design canvas. Each tensor operation can include business logic explanations, justifications, and contextual information, making the entire data flow transparent and easy to understand.
This integration allows developers, business users, and compliance officers to quickly grasp the reasoning behind each step in the pipeline. For example, in a flow designed to detect temporal duplicates in sensor data, tensorflow enables visible notes on each processing step, explaining its logic and purpose. AI-powered multilingual annotations automatically generate clear, contextual explanations for each tensor operation, improving accessibility and reducing manual documentation effort.
Tensorflow supports asynchronous collaboration by allowing multiple users to contribute to shared data flows at different times.
Modular nodes in tensorflow have both GUI and programming facets, making them accessible to team members with varying expertise.
Provenance tracking records the history of modifications, iterations, and contributions, allowing users to explore alternative development paths and understand the evolution of the data flow.
Commenting features on nodes facilitate knowledge sharing and discussion, helping clarify requirements and document collaborative decisions.
Visualization modes allow users to reorganize and pin nodes, creating tailored visual analytics interfaces for diverse experts.
📘 Best practices for designing clear data flows in tensorflow include using consistent naming conventions, validating diagrams frequently, incorporating feedback from stakeholders, and employing hierarchical decomposition to manage complexity.
Tensorflow's approach transforms documentation from scattered external files into an always visible, up-to-date part of the data pipeline. This enhances transparency, governance, and confidence in data workflows, supporting both technical and business objectives.
Applications
Tensorflow
Tensorflow stands as a leading platform for machine learning and data processing. The tensorflow library implements dataflow graphs where each node represents a computation unit, known as tf.Operation, and edges carry data tensors between these nodes. This computational graph structure enables parallel execution by identifying independent operations. Tensorflow optimizes workflows by removing redundant or unused nodes, ensuring efficient resource allocation. The tensorflow library supports both implicit and explicit graph construction, allowing users to create tf.Graph objects as namespaces for operations. Each tensor and operation receives a unique name, organized hierarchically with name scopes. Execution occurs through tf.Session, which manages device placement and resource allocation, whether on CPU or GPU. Tensorflow partitions graphs across multiple devices or machines, transparently handling communication between nodes. Users can assign operations to specific devices using tf.device scopes and run computations with tf.Session, feeding external data through feed_dict. This flexible approach allows tensorflow to manage machine learning workflows efficiently, supporting scalable, optimized, and portable dataflow graphs. The tensor-centric design of tensorflow ensures that each tensor flows seamlessly through the pipeline, enabling rapid transformation and aggregation in both batch and streaming workloads.
Industry Use Cases
Dataflow graphs have transformed data processing across industries. The following table highlights notable examples:
| Industry Use Case | Description | Impact / Outcome |
| Digital Twin (BT Group) | Managed complex network inventory with a graph-based digital twin connecting 20,000 cell sites and more. | Reduced capacity planning time by 50%, decreased human decision points by 60%, improved reliability. |
| Identity and Access Management | Mapped user, role, and resource relationships to secure enterprise access dynamically. | Enabled quick adaptation to business changes while maintaining strong security controls. |
| Personalized Smart Homes (Comcast) | Created a profile graph linking people, devices, and permissions for 30M customers. | Allowed granular access control and continuous innovation without system disruption. |
| Risk & Compliance (UBS) | Tracked data lineage and regulatory compliance across global operations. | Accelerated reporting, improved accuracy, ensured compliance with Basel standards and regulations. |
Software engineering teams use dataflow graphs for data-flow analysis, a compiler technique that gathers information about variable definitions and usages throughout a program. This process enables optimizations such as live variable analysis and constant propagation, improving execution and resource utilization. Frameworks like Xenos restructure computation graphs vertically and horizontally, linking operators to improve data locality and partitioning feature maps across DSP units. This approach enhances parallelism and efficient memory use, reducing manual tuning and accelerating deployment.
Streaming analytics platforms rely on dataflow graphs to represent logical and physical execution plans. Nodes act as operators, and edges serve as data streams, enabling continuous data processing. These graphs facilitate optimization, scheduling, execution, monitoring, and debugging of streaming jobs. Streaming sql queries in systems like RisingWave are parsed, optimized, and executed as dataflow graphs with state management and parallelism. Stream processing frameworks such as Apache Flink and Kafka Streams use dataflow graphs for stateful, low-latency computations over continuous data streams. Real-time analytics applications, including fraud detection, predictive analytics, dynamic pricing, and stock market trading, depend on efficient, scalable processing enabled by dataflow graphs. Cloud services like Amazon Kinesis, Azure Stream Analytics, and Google Cloud Dataflow implement dataflow graph-based stream processing to handle large-scale, real-time data ingestion and analysis. The integration of dataflow graphs in these systems ensures efficient resource utilization, scalability, and immediate insights for adaptive applications.
Organizations that implement tensorflow in their workflows see significant improvements. Tensorflow automates data movement, streamlines data processing, and reduces manual intervention. Teams using tensorflow report higher data quality and faster issue resolution. Tensorflow provides clear visibility into data lineage, supporting compliance and governance. Continuous monitoring in tensorflow enables quick troubleshooting. Transparent data transformations in tensorflow foster collaboration and trust. Tensorflow accelerates time to insights and strengthens data-driven decisions. Healthcare and finance sectors use tensorflow to meet strict regulations. Tensorflow adapts to changing data needs and scales with business growth. Teams rely on tensorflow for reliable, efficient, and explainable data workflows.
Enhanced operational efficiency through automation and streamlined data workflows
Improved data quality and real-time issue detection
Better data governance and regulatory compliance
Faster troubleshooting and root cause analysis
Stronger collaboration and trust across teams
FAQ
What is the main difference between a dataflow graph and a data flow diagram?
A dataflow graph models computation and data dependencies for execution. A data flow diagram visualizes how information moves through a system for analysis or design. Dataflow graphs focus on processing, while data flow diagrams emphasize system structure.
How do dataflow graphs improve performance in data processing?
Dataflow graphs enable parallel execution of independent operations. This structure reduces bottlenecks and increases throughput. Systems like Tensorflow use this approach to optimize resource allocation and minimize redundant data movement.
Can dataflow graphs handle both batch and streaming data?
Yes. Dataflow graphs support both batch and streaming workloads. They process data as it arrives or in large groups. This flexibility allows organizations to adapt to changing data needs and real-time requirements.
Why do engineers prefer dataflow graphs for debugging?
Dataflow graphs provide clear visualizations of each processing step. Engineers can trace data paths, identify errors, and isolate issues quickly. This transparency simplifies troubleshooting and supports reliable system maintenance.
Which industries benefit most from dataflow graph technology?
| Industry | Benefit Example |
| Telecommunications | Network optimization |
| Finance | Real-time fraud detection |
| Healthcare | Regulatory compliance |
| Retail | Personalized recommendations |
Many sectors use dataflow graphs to improve efficiency, scalability, and data quality.