Overview
As manufacturing shifts toward smarter solutions, more factories are adopting real-time data processing technologies to boost production efficiency, detect anomalies sooner, and improve supply chain integration.
While many companies see the benefits of integrating real-time data processing into their operations, finding and implementing the right solution can be challenging due to the complexity of deployment, usability of existing options, and lack of in-house expertise to manage and optimize the systems.
Fortunately, an increasing number of real-time data companies understand these challenges and are innovating to offer effective solutions. A promising partnership between Coreflux and RisingWave has emerged as a strong choice for manufacturing businesses seeking reliable real-time production monitoring.
What is Coreflux?
Coreflux is an IoT platform that provides advanced tools for data pipeline and management, allowing users to configure, monitor, and scale their IoT infrastructures efficiently, across multiple protocols, whether on the cloud or edge / on-prem deployments. It offers a highly efficient and scalable MQTT broker, which serves as its backbone and supports real-time communication between IoT devices and applications, enabling robust, real-time data flows across diverse devices and applications. Designed for industries where low latency, high throughput, and reliability are critical, Coreflux serves environments ranging from small-scale IoT projects to expansive industrial deployments.
What is RisingWave?
RisingWave is a Postgres-compatible SQL database engineered to provide the simplest and most cost-efficient approach for processing, analyzing, and managing real-time event streaming data.
RisingWave can ingest millions of events per second, continuously join and analyze live data streams with historical tables, serve ad-hoc queries in real-time, and deliver fresh, consistent results wherever needed.
RisingWave is a perfect platform for real-time use cases like continuous analytics, event-driven applications, data enrichment, and feature engineering. It has been adopted in a variety of industries including financial services, manufacturing, energy, sports betting, AdTech, telecommunications, and more.
Integration introduction
To illustrate the synergy of Coreflux and RisingWave for real-time monitoring in manufacturing, let’s examine the case of a beverage factory. Sensors on the production lines collect operational data, such as bottle presence and filling status. This data is serialized into JSON format and published to Coreflux’s MQTT Broker using Flux Assets like Siemens S7 and Omron PLC connectors. The Coreflux Hub serves as the central interface for managing these assets, ensuring the smooth flow of data between the PLCs and the broker. The Bridge Asset then securely transmits data from the Edge MQTT Broker to the Coreflux Cloud MQTT Broker, where it is stored for analysis.
In the cloud, RisingWave subscribes to the relevant MQTT topics, ingesting real-time data for processing. This allows the factory to continuously monitor key performance indicators, detect anomalies, and optimize production efficiency. By integrating RisingWave with Grafana, operators can visualize production metrics in an intuitive dashboard, providing clear insights into factory performance. The seamless integration of Coreflux’s scalable IoT infrastructure with RisingWave’s real-time analytics creates a robust monitoring solution tailored for modern manufacturing needs.

A sample of the data payload:
{

    machine_id INT,
    position INT,

    -- Signal Attributes
    bottle_present BOOLEAN,
    scrapped BOOLEAN,
    scrap_reason TEXT,
    machine_stopped BOOLEAN,
    cleaned BOOLEAN,
    broken_detected BOOLEAN,
    filling_started BOOLEAN,
    filling_ok BOOLEAN,
    cap_applied BOOLEAN,
    cap_ok BOOLEAN,

    -- Production Counters
    OK INT,
    NOK INT,
    scrap_type JSONB,

    timestamp TIMESTAMP
}
The entries in the machine_metrics table reflect the processing of production batches over specified time intervals.
These data fields offer a detailed view of machine operational status, production efficiency, and quality control. Analyzing this data enables manufacturers to optimize processes, enhance product quality, and improve overall operational efficiency.
Set up systems
Set up PLCs
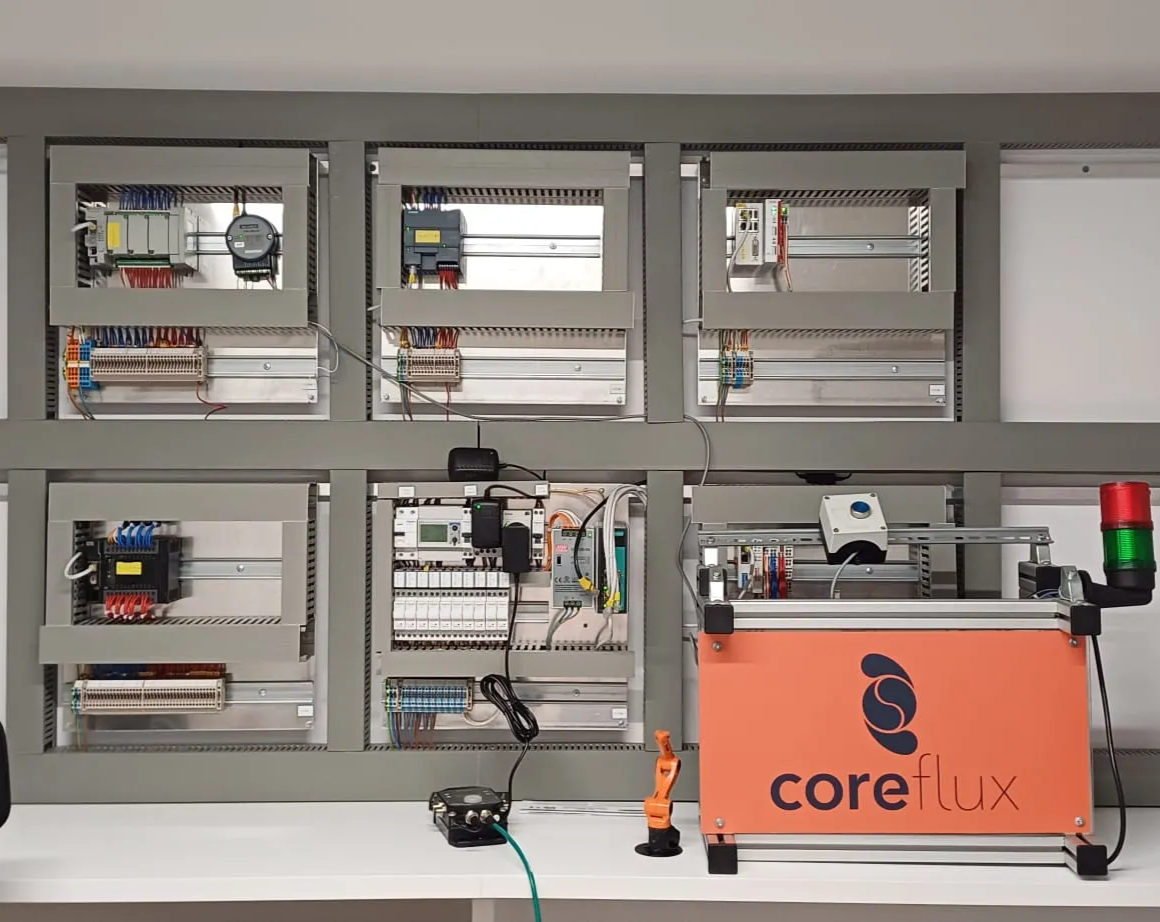
In our setup, we used Siemens and other devices like Omron PLCs to simulate a filling unit and a complete production line. The PLCs control the machinery and collect operational metrics, which are then serialized into JSON format and stored in specific memory locations.
Data Generation by PLCs
The PLCs simulate the production process and track various operational metrics, including:
Bottle Presence: Detecting whether a bottle is present at a specific stage.
Scrapping Status: Identifying if a bottle has been scrapped and the reason.
Operational Metrics: Tracking parameters like cleaning status, filling status, and cap application.
Timestamps: Recording the exact time of data generation in UTC for accurate temporal analysis.
This data is serialized into JSON and stored in predefined memory locations within the PLCs. For each production cycle, the memory register is updated with the latest JSON payload containing all relevant metrics.
Set up Coreflux
1. Setting Up a Cloud Broker
Before integrating with RisingWave, you need to set up a Coreflux MQTT broker. Follow these steps to create a broker and get the necessary credentials:
Go to mqtt.coreflux.org and create an account.
- If you don’t already have a Coreflux account, click Sign Up to create one. Fill in the required information and complete the registration process.
Once the account is created, sign in to your Coreflux account.
Start a free trial.
On the dashboard, click the Start Trial button to begin a free trial for a cloud broker.
Choose a data center region where you want your broker hosted (e.g., North America, Europe).
Activate your free trial via Stripe.
- Proceed with the free payment process through Stripe to activate the free trial. This won't charge your account but completes the setup process.
After completing the trial activation, you will receive an email containing the following details:
Broker address
Port
Username
Password
2. Setting up Edge Broker
In order to have an OT to IT gateway, OT being the plc devices and IT the mqtt broker. We need to have an Edge broker locally, serving as collector of data but also as a way to protect the OT devices for being exposed to the WWW. So we need to download and install the MQTT Coreflux Broker called the Hubless version of Coreflux.
Step 1: Download the Coreflux Edge Broker (Hubless Version)
Access the Coreflux downloads page.
- Visit coreflux.org/downloads (screenshot above for reference).
Select the Hubless version for your system.
Choose the appropriate version based on your system:
Windows (64-bit)
Linux (64-bit)
Raspberry Pi (32-bit)
Download the file. Once downloaded, extract the contents into your desired directory.
Step 2: Transform Coreflux into a service
Linux
Make Coreflux executable.
- Open the terminal and navigate to the directory where you extracted Coreflux.Run the following command to make the Coreflux file executable:
chmod +x CorefluxCentral
- To turn Coreflux into a service, create a new systemd service file by running the following command:
sudo nano /etc/systemd/system/corefluxcentral.service
- In the editor, add the following lines:
[Unit]
Description=Coreflux Edge Broker
After=network.target

[Service]
ExecStart=/path/to/CorefluxCentral
WorkingDirectory=/path/to/
Restart=always

[Install]
WantedBy=multi-user.target
Remember to replace /path/to/ with the actual directory where CorefluxCentral is located.
Enable and start the service.
- Enable the service to start on boot:
sudo systemctl enable corefluxcentral.service
- Start the service:
sudo systemctl start corefluxcentral.service
- To ensure the service is running, run the following command to check service status.
sudo systemctl status corefluxcentral.service
Set up Siemens S7 Flux Asset
Log in to Coreflux Hub.
Access Coreflux Hub in your Linux / Windows or Raspberry.
Log in using your credentials.
Access the Asset Management Interface.
Navigate to the My Broker page.
Click the Plus (+) button under the log button to access the Asset List.
For detailed steps, refer to the Asset Installation Guide.
Install Siemens S7 Asset.
In the Asset Store, find the Coreflux Siemens S7 flux asset.
Click Install Asset to install the Siemens S7 flux asset which acts as a connector between Siemens S7 PLC and MQTT.
Once installed, the asset will appear in the Broker’s Assets list.
Configure the Siemens S7 Flux Asset.
Click the three dots next to the Siemens S7 flux asset in the list to access the configuration.
Fill in the required fields:
IP Address: Set the Siemens S7 PLC's IP address (e.g.,
192.168.0.100).PLC Rack: Set to
0.PLC Slot: Set to
1.Retries: Enter the number of retries for reconnection attempts (e.g.,
3).Retry Time in Seconds: Set the retry time (e.g.,
10).Refresh Time in ms: Define the refresh rate for reading/writing PLC variables (e.g.,
1000).
For a full guide on Siemens S7 asset installation and configuration, refer to Connecting Siemens S7 to MQTT Flux asset configuration Documentation.
Set up tags for data transmission.
In the Tags tab, click Add New Tag.For each machine, configure a tag:
- Tag Name: Unique identifier for the tag (e.g.,
MachineState).Write Direction: Set toToMqtt(PLC to MQTT broker).MQTT Topic: Use the formatBigPortugueseBeerCompany/WaterBrand/PlantLocation/WaterFilling/1/CurrentState.Variable Type: Set toSTRING.PLC Address: Enter the Siemens S7 memory address (e.g.,DB10.DBB 0).Publish Behaviour: Set toTriggerAlways.
- Tag Name: Unique identifier for the tag (e.g.,
Example tag configuration:
{
  "Name": "MachineState",
  "WriteDirection": "ToMqtt",
  "MQTTTopic": "BigPortugueseBeerCompany/WaterBrand/PlantLocation/WaterFilling/1/CurrentState",
  "VariableType": "STRING",
  "Variable": "DB10.DBB 0",
  "Behaviour": "TriggerAlways"
}
- Save your configuration.
After setting up all fields and tags, click Save Config to store the configuration.
Restart the Coreflux broker for the configuration to take effect.
- Go to the Logs tab to view real-time logs and ensure the Siemens S7 Asset is functioning correctly.
Set up MQTT Bridge between brokers
In our architecture, we used the MQTT Bridge Asset to facilitate the seamless connection between the Edge MQTT Broker and the Cloud MQTT Broker. This bridge ensures that all messages published on the edge are securely relayed to the cloud for further processing and analytics. Here's how we set it up:
Install the MQTT Bridge Asset.
- Log into the Coreflux Hub as described in the earlier sections and install the MQTT Bridge Asset in your Edge Broker.
Configure the Bridge.
Once installed, access the MQTT Bridge Asset in the asset list.
Click the three dots to access the configuration settings.
Provide the following details:
Source Broker:
ClientID: Unique identifier (e.g.,
"ClientID": "EdgeClient1").Address: IP address of the Edge MQTT Broker (e.g.,
"192.168.0.10").Port: Set to
1883or8883for a secure connection.Username/Password: Provide credentials if needed.
Topic: Specify the topics to forward (e.g.,
BigPortugueseBeerCompany/WaterBrand/PlantLocation/#for all topics).
Destination Broker:
ClientID: Unique identifier for the Cloud MQTT Broker (for example,
"CloudClient1").Address: IP address of the Cloud MQTT Broker (for example,
"broker_<address>.coreflux.cloud").Port: Use
8883for secure connections.Username/Password: Provide credentials for cloud authentication.
Topic Mapping: Use the same topics as the source to replicate the data.
Save the configuration.
Once configured, click Save Config to apply the settings.
The MQTT Bridge Asset will begin relaying data between the Edge and Cloud brokers.
Monitor logs.
- In the Logs tab, you can monitor the status and activity of the bridge to ensure it's functioning correctly and forwarding data as expected.
This bridge allows for efficient, scalable communication across the manufacturing plant and the cloud environments with this we have the broker with the proper data in the MQTT.
For more detailed steps, you can refer to the MQTT Bridge Documentation.
Set up RisingWave
Create a RisingWave cluster in RisingWave Cloud using the free plan. See the documentation of RisingWave Cloud for instructions.
Create a source in RisingWave. Once you have deployed the RisingWave cluster, create a source in the Workspace using the following SQL query:
CREATE TABLE machine_metrics (

    machine_id INT,
    position INT,

    -- Signal Attributes
    bottle_present BOOLEAN,
    scrapped BOOLEAN,
    scrap_reason TEXT,
    machine_stopped BOOLEAN,
    cleaned BOOLEAN,
    broken_detected BOOLEAN,
    filling_started BOOLEAN,
    filling_ok BOOLEAN,
    cap_applied BOOLEAN,
    cap_ok BOOLEAN,

    -- Production Counters
    OK INT,
    NOK INT,
    scrap_type JSONB,

    timestamp TIMESTAMP
)
 WITH (
    connector='mqtt',
    url='ssl://xxxxxxxxxxxxxxx.coreflux.cloud:8883',
    topic= 'factory/machine_data',
    username='admin',
    password='xxxxxxxxxxx',
    qos = 'at_least_once',
) FORMAT PLAIN ENCODE JSON;
Real-time data ingestion and analytics in RisingWave
Now the data is continuously ingested into RisingWave, you can perform analysis using real-time materialized views in RisingWave.
Below are some examples of the analysis that you can perform.
Calculate machine production efficiency by an interval
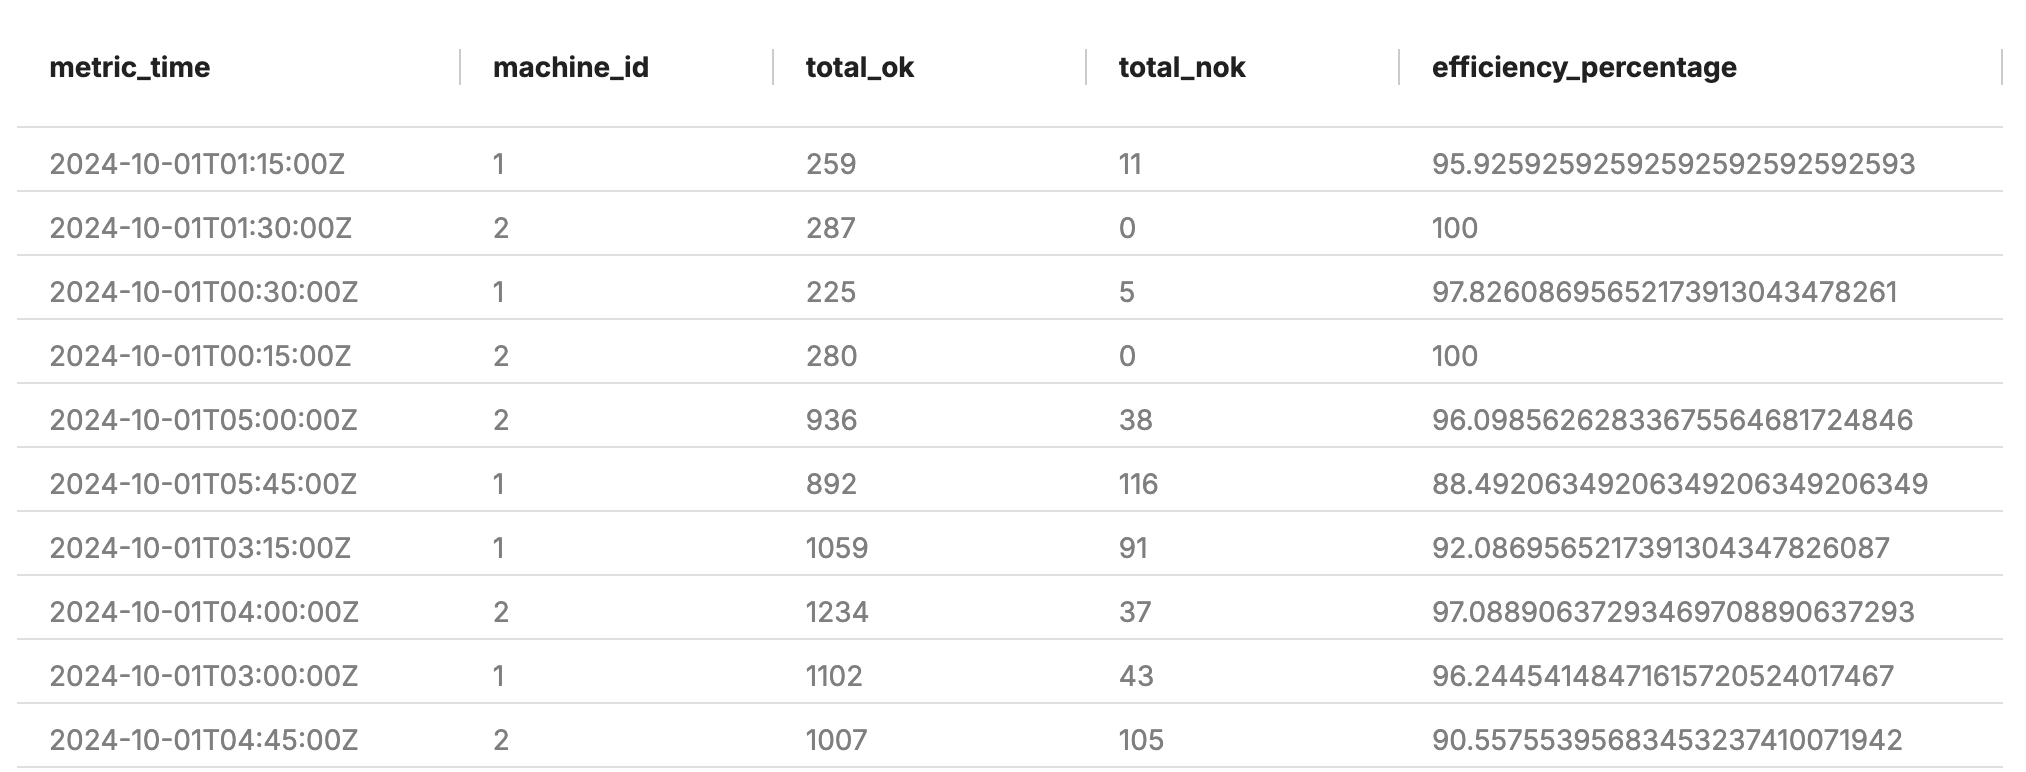
This query calculates the production efficiency for each machine per hour. This helps identify trends in production performance. We use tumbling window functions to aggregate data for each time window. You can revise the cadence of analytics to use a shorter or longer interval that makes sense in your environment.
CREATE MATERIALIZED VIEW product_efficiency_15_minute AS
SELECT window_start as metric_time,
    machine_id,
    SUM(OK) AS total_ok,
    SUM(NOK) as total_nok,
    SUM(OK) * 100.0 / NULLIF(SUM(OK) + SUM(NOK), 0) AS efficiency_percentage
    FROM TUMBLE (machine_metrics, timestamp, INTERVAL '15' MINUTE)
GROUP BY window_start, machine_id;
We want to get the always latest results and the materialized view in RisingWave allows us to do exactly that.
If we query the materialized view, we’ll get results similar to these:
SELECT * FROM product_efficiency_15_minute limit 10;
If you only need to get the analytics for the most recent data, you can use a temporal filter, for example:
WHERE timestamp >= NOW() - INTERVAL '12' HOUR
Duration of downtime over a specified time window
This query examines the total downtime duration for each machine in each 1-hour time window, identifying patterns and trends in machine performance.
CREATE MATERIALIZED VIEW downtime_each_hour AS
SELECT
    machine_id,
    window_start,
    COUNT(*) AS total_stops,
    SUM(CASE WHEN machine_stopped THEN 1 ELSE 0 END) AS current_downtime_events
FROM
    TUMBLE(machine_metrics, timestamp, INTERVAL '1' HOUR)
GROUP BY
    machine_id, window_start
ORDER BY
    machine_id, window_start DESC;
Calculate the daily scrap rate for each machine
This query calculates the scrap rate, which is the proportion of scrapped products to total production (both OK and NOK) for each machine for each 2-hour time window.
CREATE MATERIALIZED VIEW scrap_rate_2_hour AS
SELECT
    machine_id,
    window_start,
    SUM(CASE WHEN scrapped THEN 1 ELSE 0 END) AS total_scrapped,
    SUM(OK) + SUM(NOK) AS total_produced,
    (SUM(CASE WHEN scrapped THEN 1 ELSE 0 END) * 100.0) / NULLIF(SUM(OK) + SUM(NOK), 0) AS scrap_rate_percentage
FROM
    TUMBLE(machine_metrics, timestamp, interval '2' hour)
GROUP BY
    window_start, machine_id;
Data visualization in Grafana
We can visualize the real-time results in visualization and observability tools like Grafana. RisingWave can be used as the data source for these tools without additional configuration.
To learn about how to connect Grafana to RisingWave, see Configure Grafana to read data from RisingWave. For RisingWave Cloud instances, you can find the connection URL by clicking Connect on the instance panel.
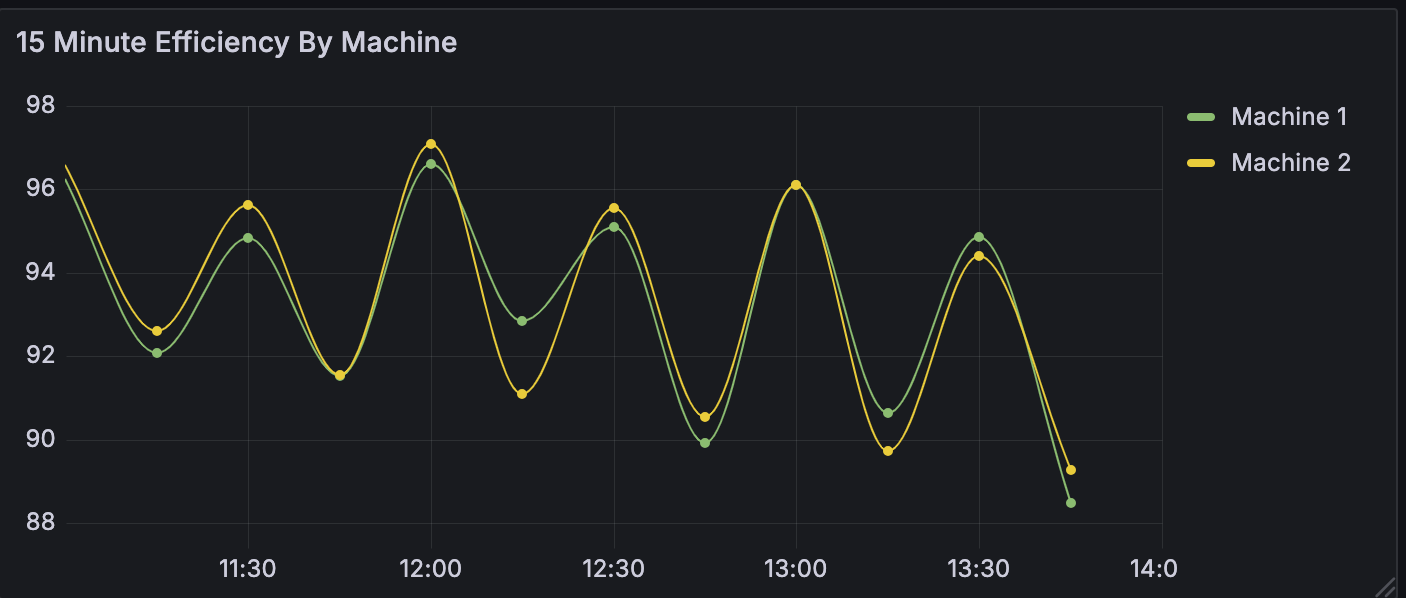
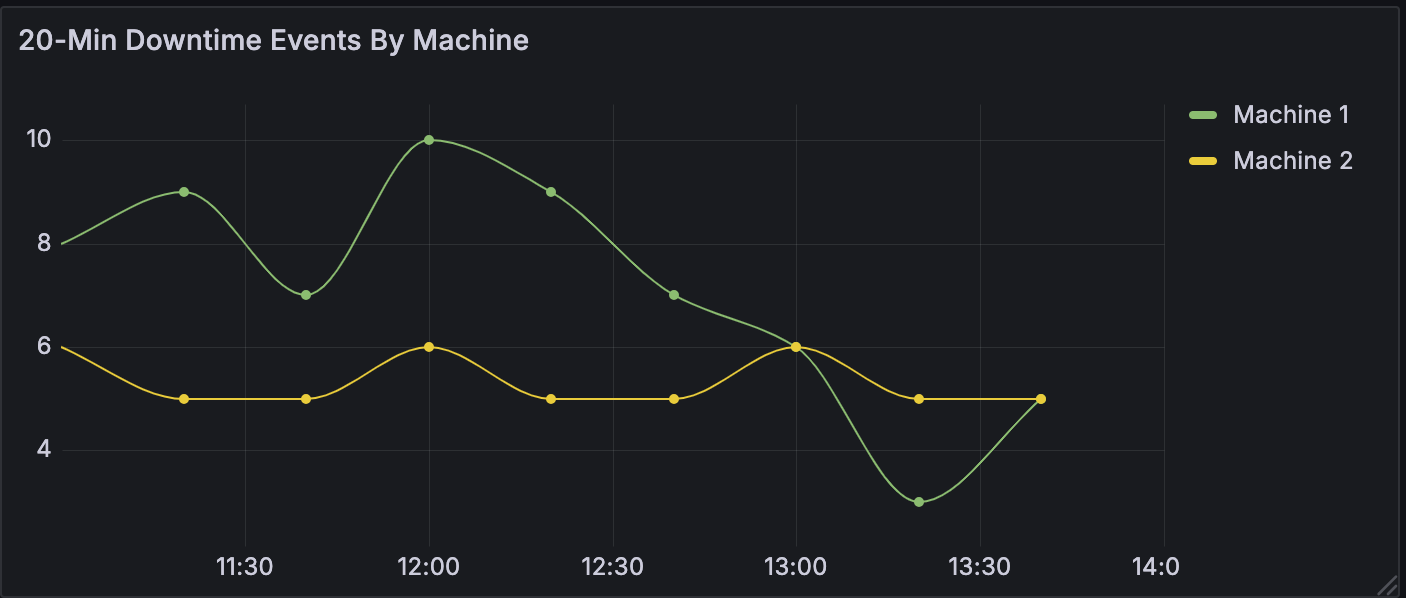
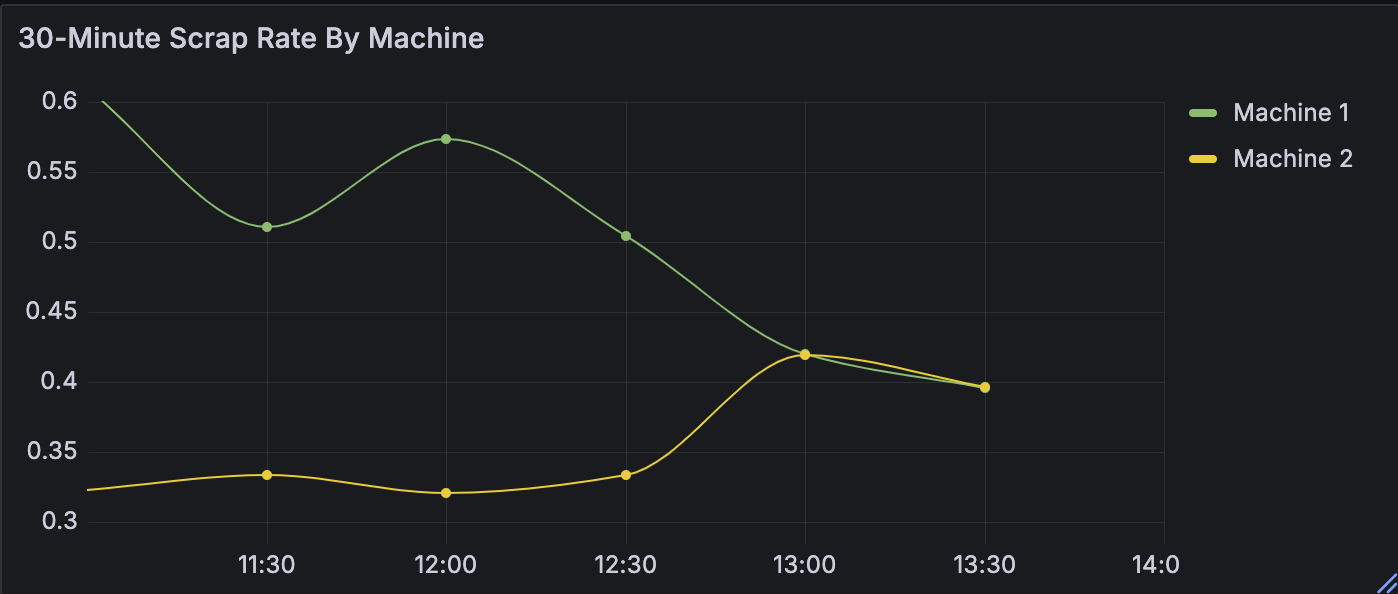
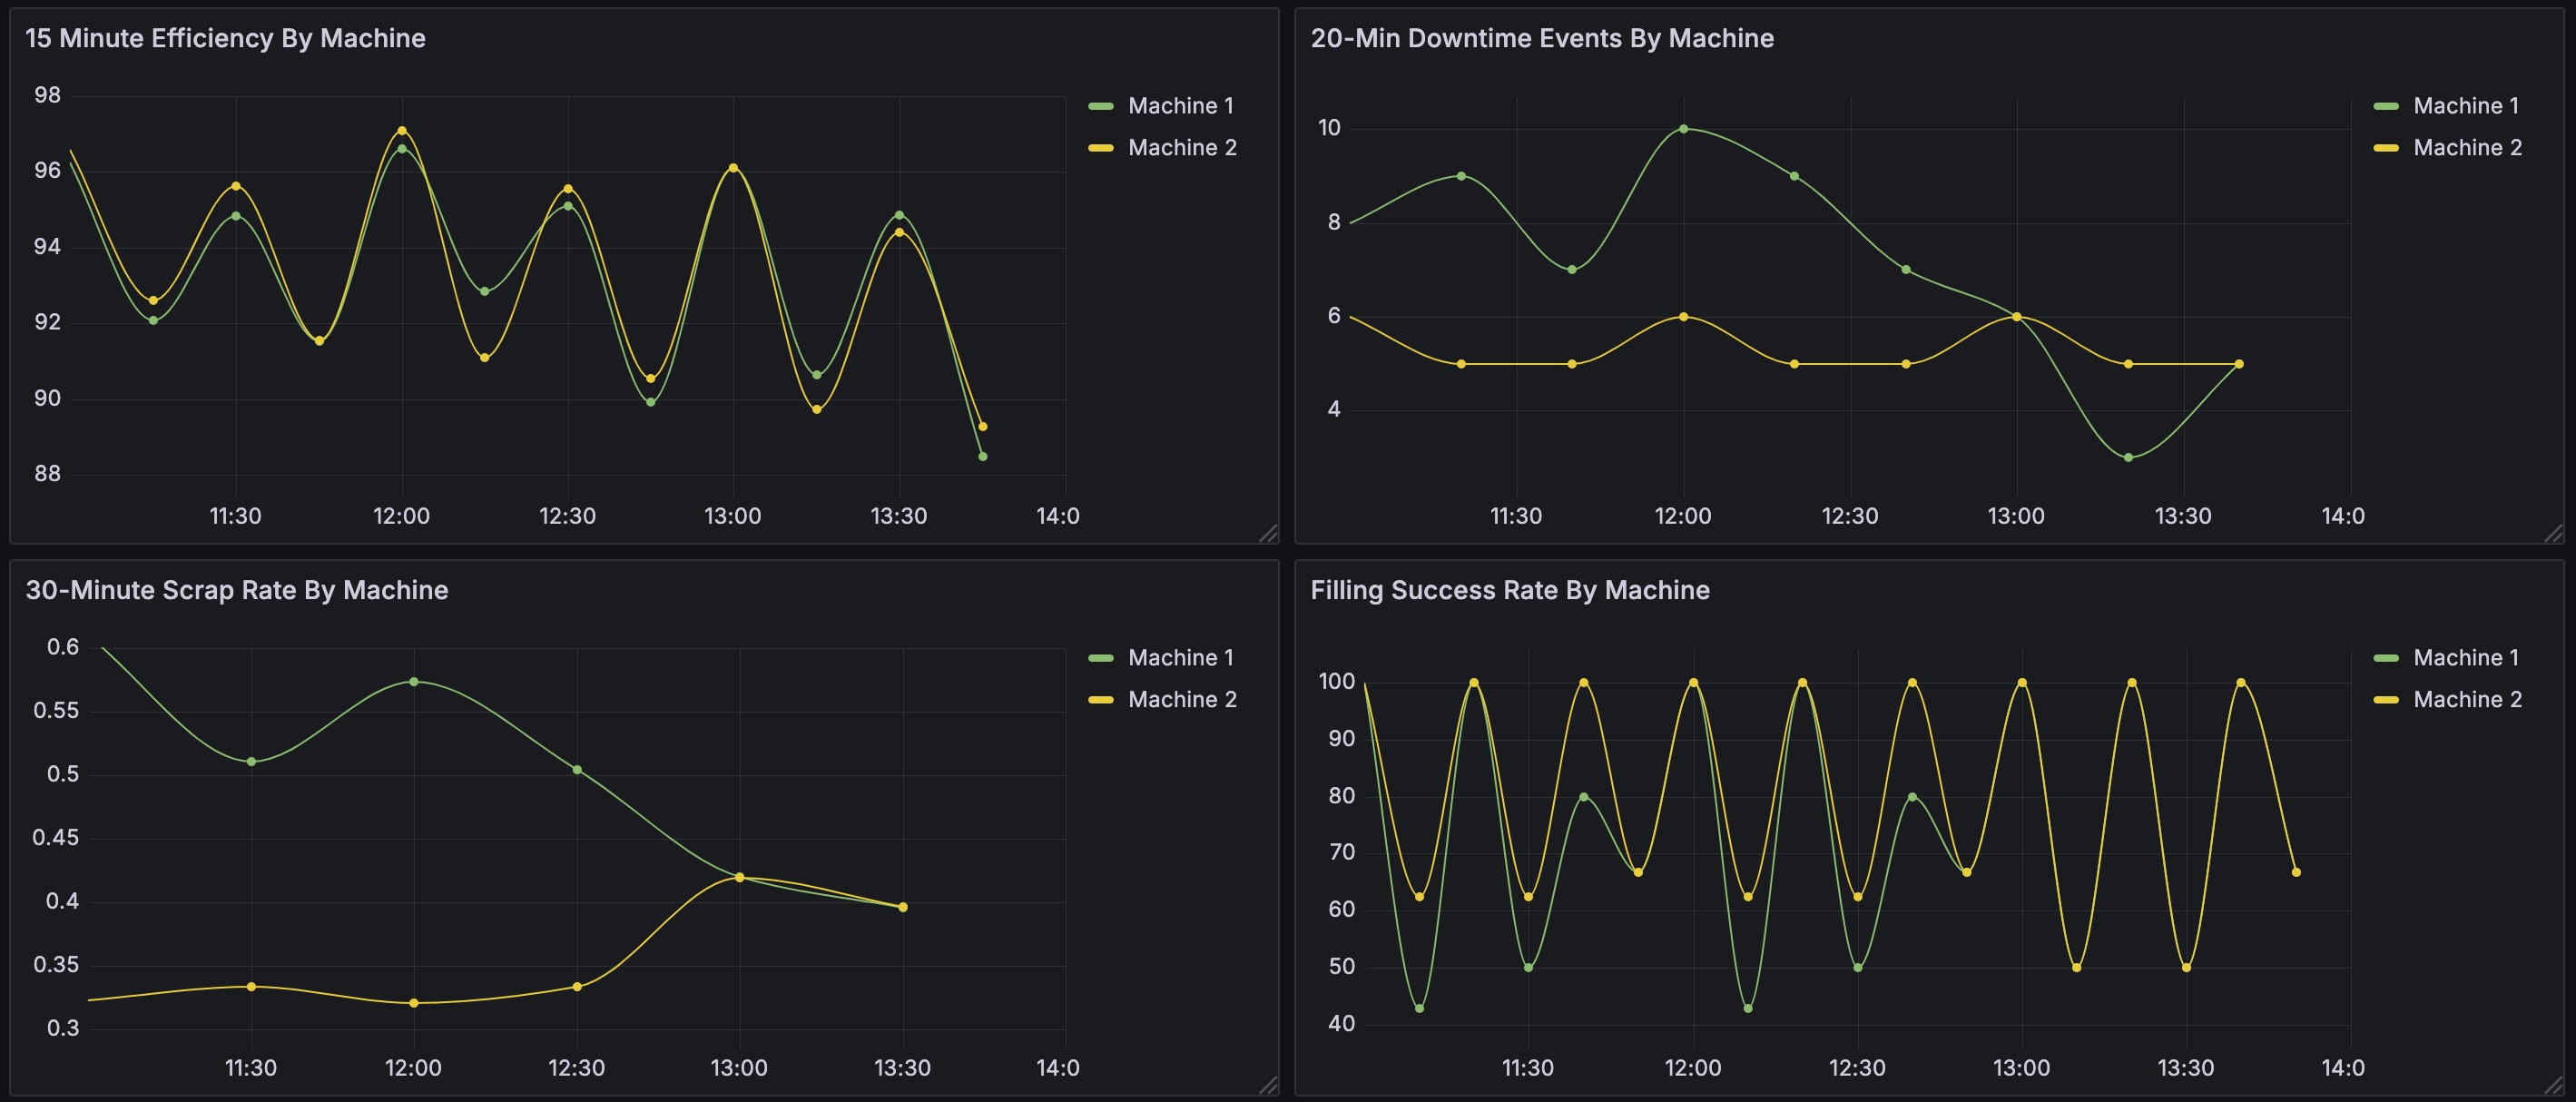
For the above analytics, we can get the following visualizations.
15-minute efficiency by machine
20-minute downtime events by machine
30-minute scrap rate by machine
Overview of all metrics
You can also combine all these metrics in one overview dashboard.
To recap, we've demonstrated how to build a real-time monitoring solution for manufacturing businesses using Coreflux and RisingWave. One of the key benefits of leveraging the cloud editions of these products is that we can bypass the complexities of deployment, such as environment dependencies. With this approach, you can set up a complete solution for real-time event messaging and processing in IIoT and manufacturing environments in just a few hours.
The analysis presented in this blog post has been simplified for easier understanding. We encourage you to experiment with real-world data analysis using actual data. We would love to hear your feedback on this solution.
If you would like to stay up to date on what RisingWave is up to, sign up for our communit to talk to our engineers and hundreds of streaming enthusiasts.
To learn more about Coreflux, check out the Coreflux Community


